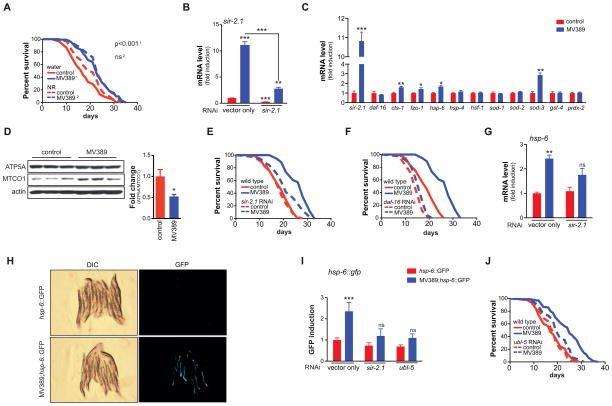
Figure 5. sir-2.1 overexpression extends lifespan through UPRmt.
(A) Outcrossed sir-2.1 transgenic worms live significantly longer compared to control worms. MV389 represents the outcrossed sir-2.1 overexpressing strain. p-value is shown in the graph.
(B) sir-2.1 is robustly overexpressed in sir-2.1 transgenic worms. This induction is almost completely blocked by sir-2.1 RNAi demonstrating specificity.
(C) sir-2.1 overexpression induced the gene expression of cts-1 (TCA cycle), fzo-1 (mitochondrial fusion), hsp-6 (UPRmt) and sod-3 (ROS defense), but not of other stress genes or of the ROS defense regulator daf-16.
(D) sir-2.1 overexpression in MV389 induced mitonuclear protein imbalance, as evidenced by the reduction in the ratio between nDNA-encoded ATP5A and mtDNA-encoded MTCO1. The Western blot depicts three independent samples for each strain, while the right panel shows a quantification of the mitonuclear protein imbalance.
(E–F) (E) sir-2.1, and (F) daf-16 RNAi abrogated the lifespan extension of MV389
(G) sir-2.1 overexpression in the MV389 strain induces the UPRmt gene hsp-6, an effect that is attenuated upon sir-2.1 RNAi.
(H–I) In MV389 worms that were crossed with the UPRmt (hsp-6::GFP) reporter worms, UPRmt was markedly increased compared to hsp-6::GFP control worms. Panel H shows GFP expression in sir-2.1 wild type (top) and sir-2.1 overexpressing (bottom) worms. Panel I shows the quantification of this GFP signal and that this induction was attenuated upon ubl-5 or sir-2.1 RNAi.
(J) ubl-5 RNAi abrogated the lifespan extension of MV389.
Bar graphs are expressed as mean±SEM, * p≤0.05; ** p≤0.01; *** p≤0.001.
See Table S1 for additional detail on the lifespan experiments.

