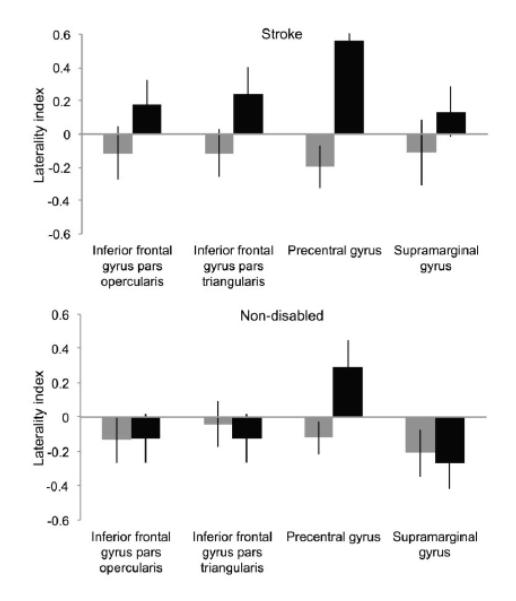
Figure 2.
Laterality index of brain activity during action observation. For participants with stroke (top), and non-disabled participants (bottom); during left hand (gray bars) and right hand (black bars) action observation, in regions of interest. Positive values indicate left hemisphere dominance, negative values indicate right hemisphere dominance.

