Fig. 3.
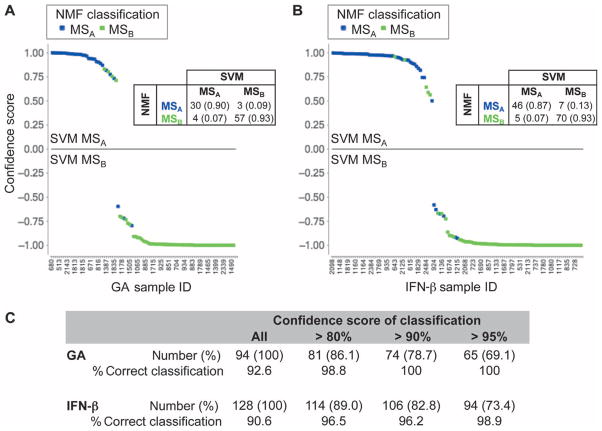
Top probe sets differentially expressed between MSA and MSB subsets in untreated subjects predict subject class in the GA- and IFN-β–treated subject groups. (A and B) The results of supervised SVM classification for GA (A) and IFN-β (B) using the untreated signature are shown. The confidence score for each SVM classification is plotted on the y axis. On the x axis, each subject is arrayed on the basis of the rank order of the likelihood of belonging to MSA after SVM classification. Each point represents one subject. The upper portion of each graph contains those classified as MSA by the SVM classifier; the lower portion contains MSB subjects. The unsupervised NMF-derived classification, which is used as the reference classification, is reported in color: blue, MSA; green, MSB. Thus, the misclassified subjects are readily apparent. The confusion matrix that compares the NMF and SVM classifications is reported in each graph; the number and percentage (in parenthesis) of subjects found in each cell of the confusion matrix is shown. A total of 94 GA-treated subjects and 128 IFN-β–treated subjects were classified. (C) The table reports the success of the classifier at different confidence thresholds for the SVM classification and the proportion of subjects (in parenthesis) that meet each threshold. Most of the misclassified individuals were the result of low confidence classifications.

