
Figure 2.
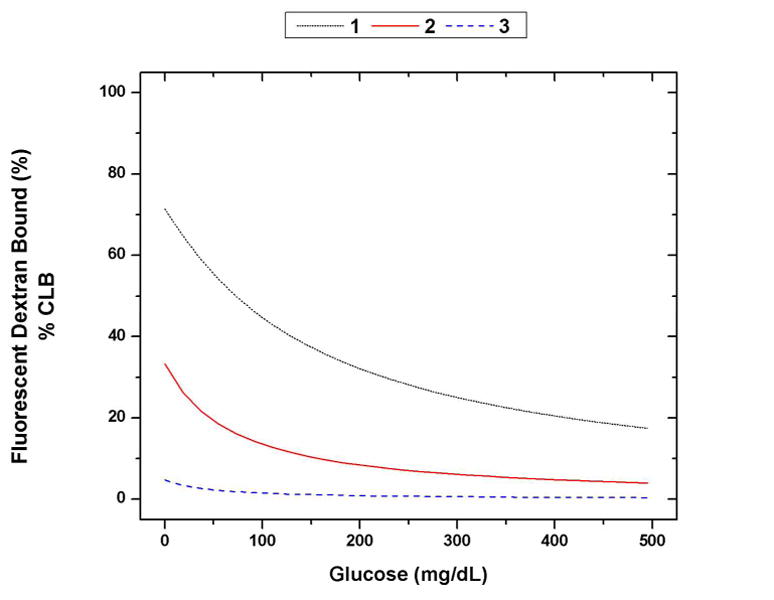
Modeled responses of fluorescent dextran bound (% CLB) versus glucose for different assay configurations: (1) 500 μM ConA, 1 μM dextran, (2) 100 μM ConA, 1 μM dextran, (3) 10 μM ConA, 1 μM dextran. The change in % CLB from 0 mg/dL to 300 mg/dL for 1, 2, and 3 is 45%, 27%, and 4%, respectively.