
Figure 3.
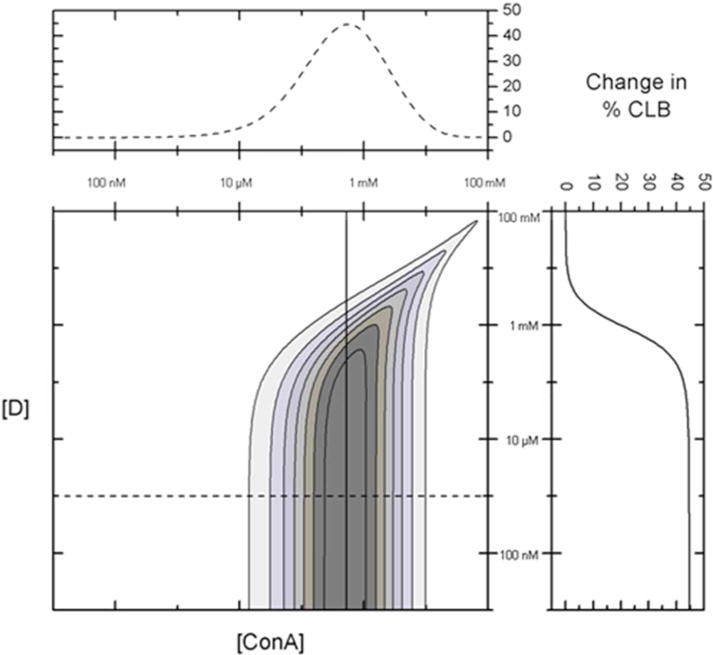
Change in % dextran bound to ConA (% CLB) from 0 mg/dL to 300 mg/dL glucose for various ConA and dextran (D) combinations. The change in % CLB to ConA is maximized at 45% for a ConA concentration of approximately 500 μM and dextran concentrations less than 100 μM. The inset to the top shows the change in % CLB vs [ConA] with [D] fixed at 1 μM (dotted line). The inset to the right shows the change in % CLB vs [D] with [ConA] fixed at 500 μM (solid line).