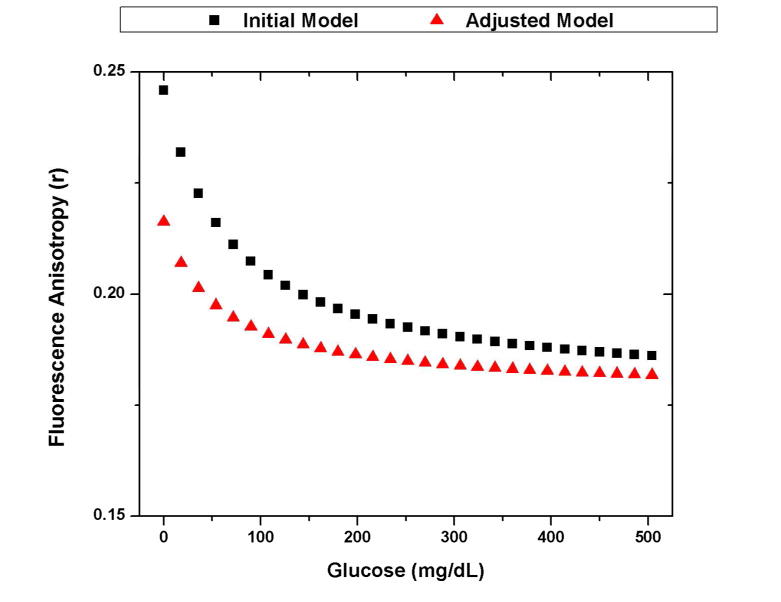
Figure 5.

The initial and adjusted models of the glucose anisotropy response for an assay based on 1 uM FITC-dextran and 100 uM ConA. The initial model uses the assumption that there is no change in the fluorescence lifetime upon binding to ConA (4 ns free, 4 ns bound). The adjusted model takes into account the effects from the experimentally measured decrease in lifetime (3.9 ns free, 1.7 ns bound).
