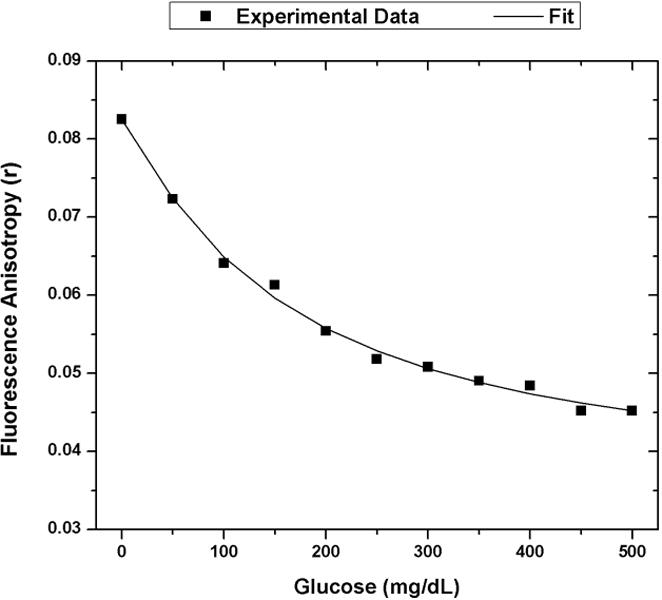
Figure 6.

Calibration model for FA competitive binding glucose assay. The optimized assay configuration of 100 uM ConA and 1 uM 4 kDa FITC-dextran was exposed to glucose concentrations from 0 mg/dL to 500 mg/dL. The experimental FA response was plotted with black squares. The calibration fit using Equation 8 is shown as the solid black line. (A = 0.0825, B =1.126, C = 160.4, D = 0.03485). The R-square value for this fit is 0.9951.
