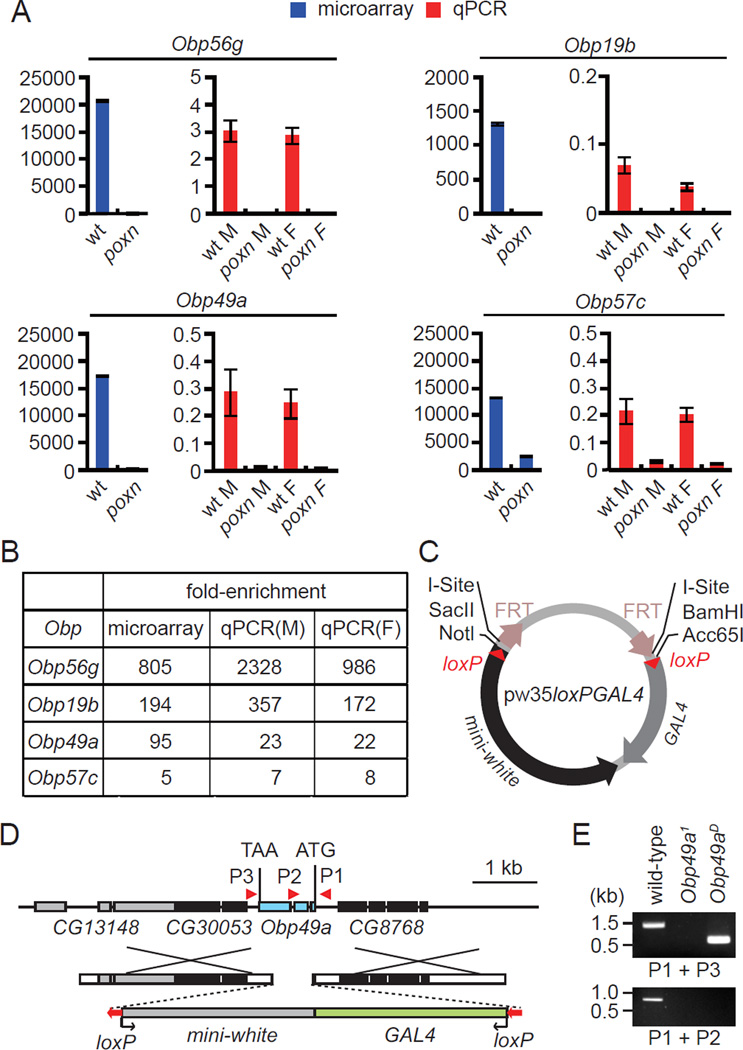
Figure 1. Obp genes with enriched expression in the labella, and generation of the Obp49a mutant.
(A) Relative expression of Obp RNAs in the labella of wild-type and poxn mutants. RNA expression was analyzed by microarray analysis (blue bars) and real-time PCR (red bars). The real time PCR analysis was performed using RNA prepared from separate males (M) and females (F). The numbers on the Y-axis are arbitrary units, which indicate relative rather than absolute levels of the various RNAs. Shown are the means ±SEM (n=3, microarray data; n=4—6, real time PCR). (B) Comparison of the enrichment of Obp genes as assessed by microarray and RT-PCR analyses using RNA prepared from males (M) and females (F). (C) The pw35loxPGAL4 vector used to generate the Obp mutants. (D) Schematic of the Obp49a locus and the targeting construct used to generate the Obp49a1 allele. The Obp49aD allele was derived by removing the floxed mini-white and GAL4 genes. The boxes represent exons, and the orientation of the mini-white-GAL4 and loxP are indicated by the arrows. (E) Confirmation of the deletion in Obp49a1 and the excision of the mini-white and the GAL4 in Obp49aD. Genomic DNA was prepared and PCR performed using the primer pairs (P1, P2, and P3) indicated in panel D (see also Figure S1).

