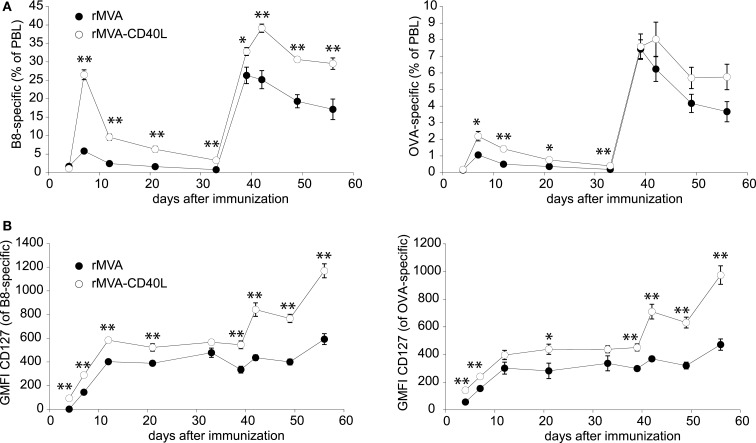
Figure 6.
Increased CD8 T cell response after rMVA-CD40L immunization. C57BL/6 mice were immunized with rMVA and rMVA-CD40L on day 0 and 35. The primary and secondary B8- and OVA-specific CD8 T cell response was quantified by dextramer staining of PBL at the indicated time points as shown in Figure 1A. (A) The kinetic analysis shows the mean percentage ± SEM of CD8+ dextramer+ T cells among PBL. (B) B8- and OVA-specific CD8 T cells were also analyzed flow cytometrically for surface expression of CD127. Data are represented as the mean ± SEM GMFI. Data are representative of five mice per group and two independent experiments.

