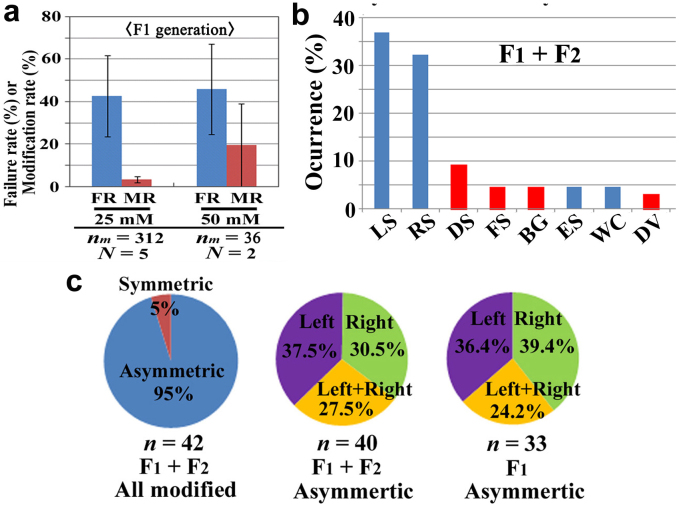
Figure 3. Failure rate, modification rate, occurrence of modification types, and asymmetry of modifications in the F1 and F2 generations.
(a) The failure rate (FR) and the modification rate (MR) in the F1 generation. The number of trials (N) and the mean number of individuals (larvae) per trial (nm) are indicated (thus, these numbers are different from those of normal eclosion shown in Supplementary Table 2). The relatively large MR at 50 mM may be due to the small number of individuals obtained. (b) The occurrence of the modification types in the F1 and F2 generations. Those not obtained in the P generation are shown in red bars. Total number of modified individuals was 42 (Supplementary Table 2), but because a given individual was classified into one or two categories for modification type(s), total number of counts was 65 (Supplementary Table 5). (c) Symmetric and asymmetric modifications in the F1 and F2 generations. Most mutant individuals were asymmetric (left graph) as expected in the EMS mutagenesis. Among the asymmetric individuals obtained (middle and right graphs), right- and left-wing modifications occurred more or less equally.

