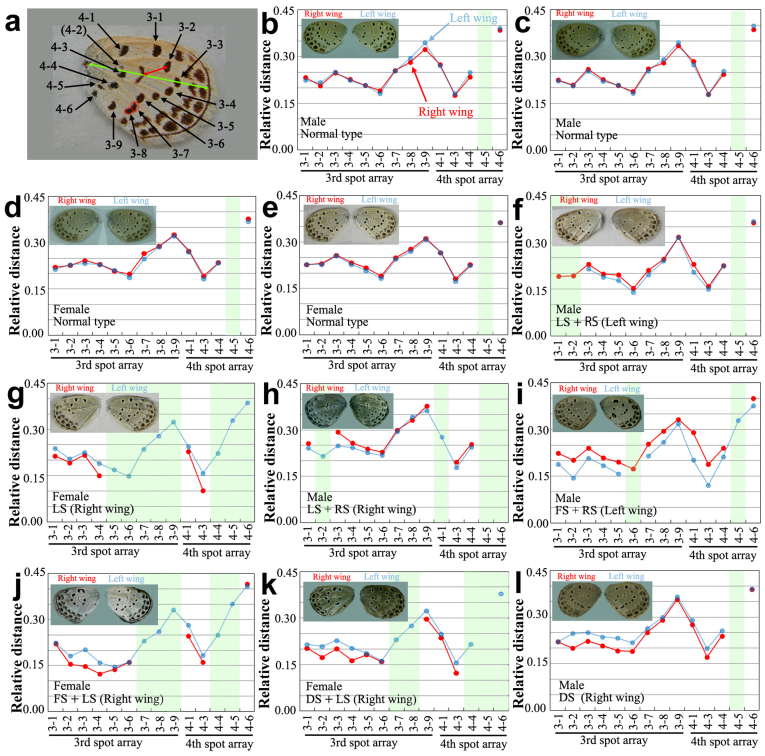
Figure 5. Morphometric analysis of the spot distances.
Spots that belong to the third and fourth arrays on the right (shown in red in graphs) and left (shown in blue in graphs) wings were measured. In these graphs, the portions of “lost spots” were shaded in light green. The spot 4-2 was not shown in the graphs, because it is not found even in the normal type. (a) Nomenclature of spots that belong to the third and fourth spot arrays and the measurements of their relative distances. Spots were numbered from the anterior side to the posterior side. Spots that belong to the first and second arrays were similarly named (see Supplementary Fig. 3). Distances were measured between the centre of the discal spot and the centre of each spot (in this example, the spot 3-2), as indicated by a red line. The wingspan was measured from the wing base to the end of the M1 vein, as indicated by a green line. The spots 3-7 and 3-8 (circled) often fuse together, but they were considered independent. (b-e) Normal types. The right and left values coincided in most spots. (f) An LS+RS type. The spots 3-1, 3-2, and 4-5 were lost, and spots 3-3, 3-4, 3-5, 3-6, and 4-1 of the right wings were slightly dislocated away from the discal spot, compared to those of the left wing. Similar dislocations are more apparent in (g–l). (g) An LS type. The spots 3-5 to 3-9 and 4-4 to 4-6 were lost, and many spots were disarranged. (h) An LS+RS type. (i) An FS+RS type. (j) An FS+LS type. (k) A DS+LS type. (l) A DS type.

