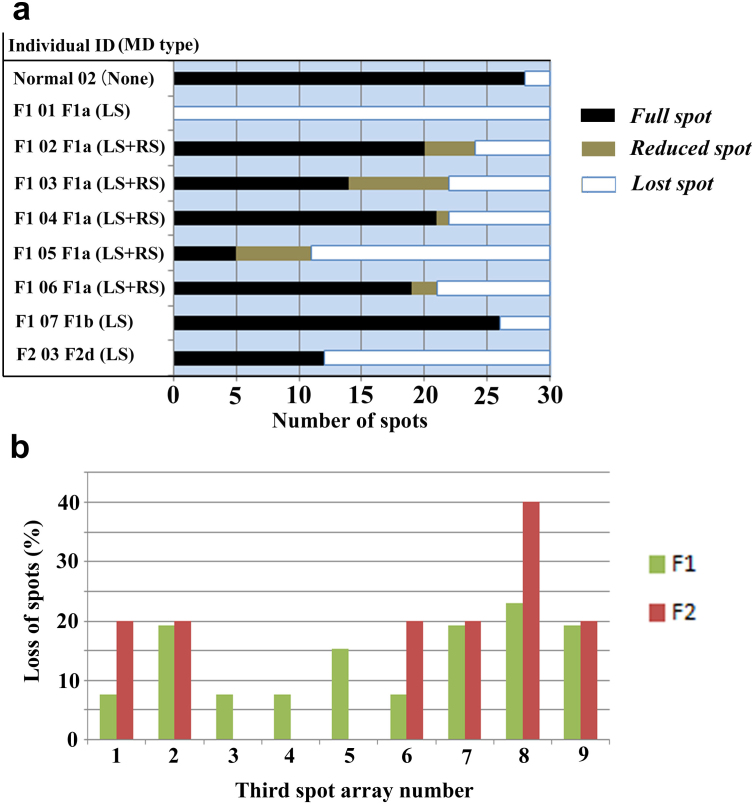
Figure 6. Full, reduced, and lost spots in the F1 and F2 mutants.
(a) The three-state spot assignment in representative individuals. There are 30 spots in the third and fourth spot arrays in the right and left hindwings in total (15 spots each). Number of full (black), reduced (gray), and lost (white) spots are counted and graphically shown. The ID number corresponds to the list of Supplementary Tables 9–18. Note the diverse patterns in these individuals. (b) Percentages of loss of each spot in the right hindwings among the F1 and F2 individuals. See Fig. 5a for spot number identification, and see Supplementary Table 20 for more detail. Note that the percentages are not even among the third array spots, and that the relatively high percentages of loss are seen together in the high-number spots (i.e., spots 7, 8, and 9).

