
Figure 1.
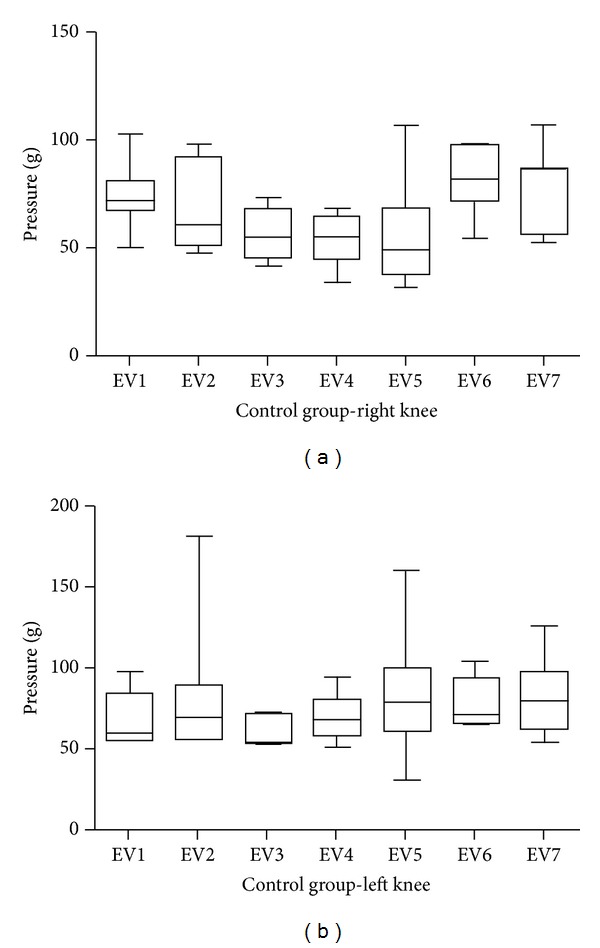
Graphical representation of the pressure threshold on the paw plantar surface of the control group to the right side (a) and the left (b). There were no significant differences in any evaluation.
Official websites use .gov
A
.gov website belongs to an official
government organization in the United States.
Secure .gov websites use HTTPS
A lock (
) or https:// means you've safely
connected to the .gov website. Share sensitive
information only on official, secure websites.
Graphical representation of the pressure threshold on the paw plantar surface of the control group to the right side (a) and the left (b). There were no significant differences in any evaluation.