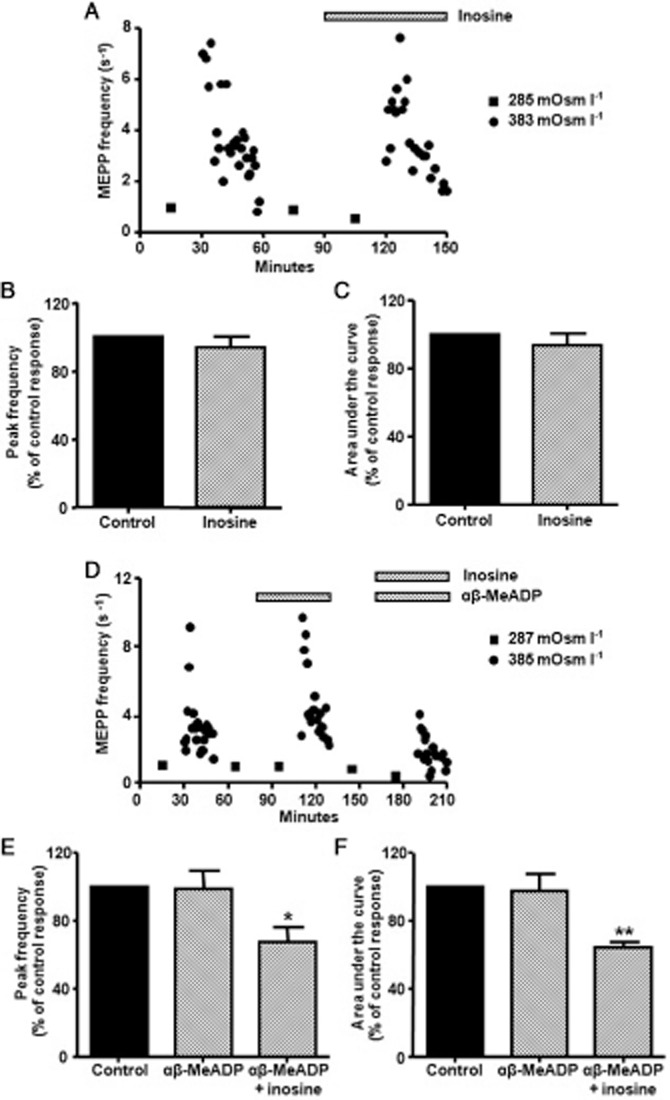
Figure 7.

Effect of 100 μM inosine on the hypertonic response. (A) Effect of inosine on ACh release when a diaphragm muscle was exposed to isotonic and hypertonic conditions. (B,C) Summary bar graphs show the lack of a modulatory effect of inosine on the peak frequency and area under the curve of the hypertonic response (n = 4). (D) Effect of inosine on ACh release when a diaphragm muscle was exposed to isotonic and hypertonic conditions in the presence of 100 μM αβ-MeADP. (E,F) Summary bar graphs showing the modulatory effect of inosine on the peak frequency and area under the curve of the hypertonic response (n = 7) when the production of adenosine was inhibited by αβ-MeADP. In (A) and (D), square symbols indicate mean values from 10 synapses obtained after exposing the preparations to isotonic condition and circles represent the time course of hypertonic response (each point represents averaged value of MEPP frequency recorded from a single synapse). In (B), (C), (E), and (F), data (mean ± SEM) are expressed as percentage of control values. **P < 0.01, *P < 0.05, anova followed by Tukey's test.
