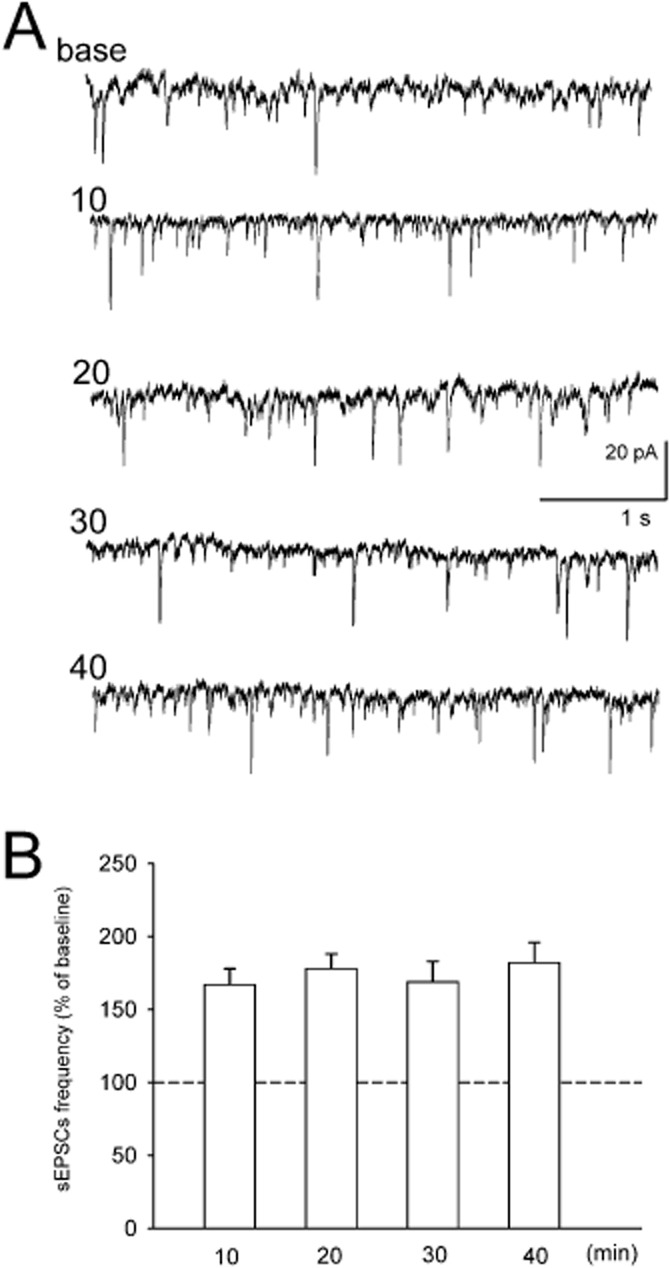
Figure 8.

(A). Examples of sEPSCs recordings from brain slices. Base – recording before DOI application. Numbers denote time after the beginning of DOI application (minutes). (B) Mean (± SEM) frequency of sEPSCs over 5 min periods beginning at indicated time points. Data are normalized to baseline recording obtained before 10 uM DOI application (n = 4).
