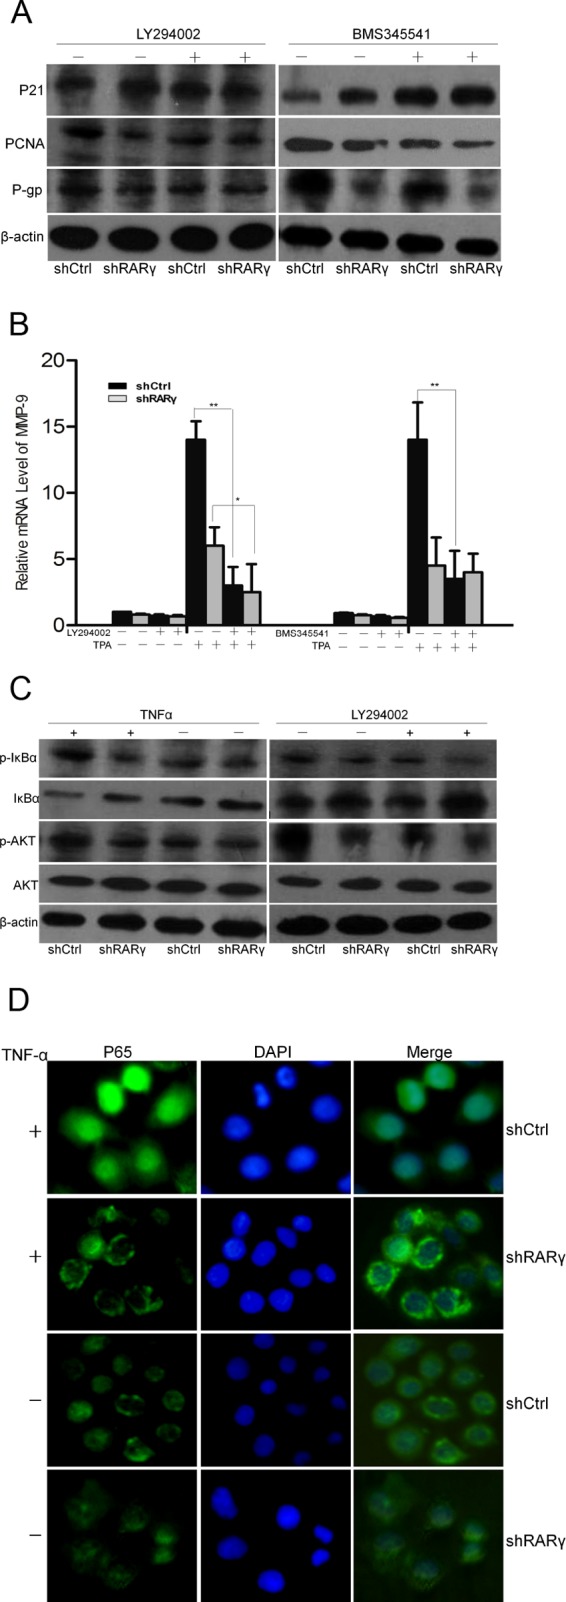
Fig 4.

Activation of the Akt/NF-κB pathway in shCtrl and shRARγ cells in the presence or absence of inhibitors. (A) Western blot analysis of P21, PCNA, and P-gp protein expression. (B) Expression of MMP-9 mRNA detected by qPCR in cells with or without TPA treatment. The error bars indicate SEM. (C) Phosphorylation of key signaling proteins for the Akt/NF-κB pathway measured by Western blotting. (D) Cellular localization of p65 after TNF-α treatment detected by IF. LY294002, 1 μM; BMS345541, 1 μM; TPA, 100 nM; TNF-α, 30 μg/liter. Magnification, ×200. *, P < 0.05; **, P < 0.01.
