Fig 3.
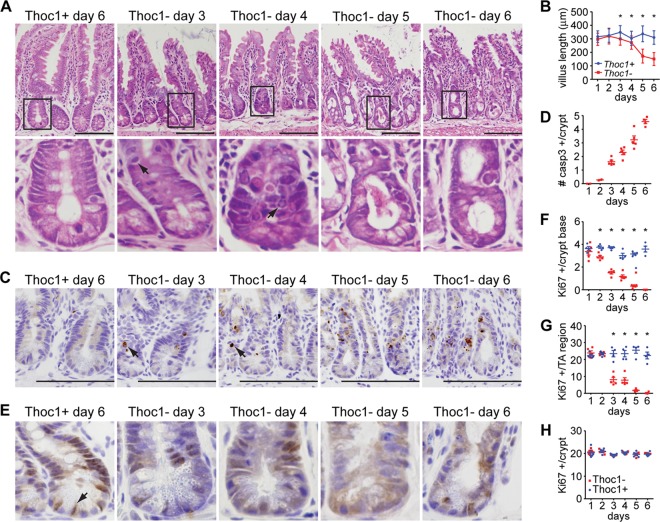
Thoc1 loss compromises cell proliferation and viability in the small intestinal crypt. (A) The histology of the small intestine in Thoc1F/F::Rosa26CreERT2 (Thoc1−) or Thoc1+/+::Rosa26CreERT2 (Thoc1+) mice was characterized at the indicated times from the start of tamoxifen treatment. Representative images are shown. The lower panels magnify the indicated crypts from the upper panels. Arrows highlight cells with apoptotic morphology. Scale bars represent 200 μm. (B) The length of the small intestinal villus was measured at the indicated times from the start of tamoxifen treatment in mice of the indicated genotypes. The data points represent the means and standard errors of the results deteermined for approximately 300 villi from 3 mice for each genotype. Asterisks indicate statistically significant differences between genotypes (t test, P < 0.01). (C) The tissue sections described for panel A were immunostained for the activated form of caspase-3. Representative images are shown. The arrow highlights immunopositive cells. Scale bars represent 200 μm. (D) The number of activated caspase-3 immunopositive cells per small intestinal crypt from tamoxifen-treated Thoc1F/F::Rosa26CreERT2 mice was determined by counting. Each data point represents the number determined from a different mouse. Error bars are the standard errors of the means. No immunopositive cells were detected in control mice. (E) The tissue sections described for panel A were immunostained for the proliferation marker Ki67. Representative images are shown. The arrow highlights an immunopositive cell from the crypt base. (F) The number of Ki67-immunopositive cells per small intestinal crypt base (at or below the +4 position) was determined by counting cells at the indicated time from the start of tamoxifen treatment from Thoc1F/F::Rosa26CreERT2 or Thoc1+/+::Rosa26CreERT2 mice. Each data point represents the number determined from a different mouse. Error bars represent the standard errors of the means. Asterisks indicate statistically significant differences between genotypes (t test, P < 0.01). (G) The Ki67-immunopositive cells in the transit-amplifying region of the small intestinal crypt (above the +4 position) were counted as described for panel B. (H) The Ki67-immunopositive cells were counted in large intestinal crypts as described for panel F.

