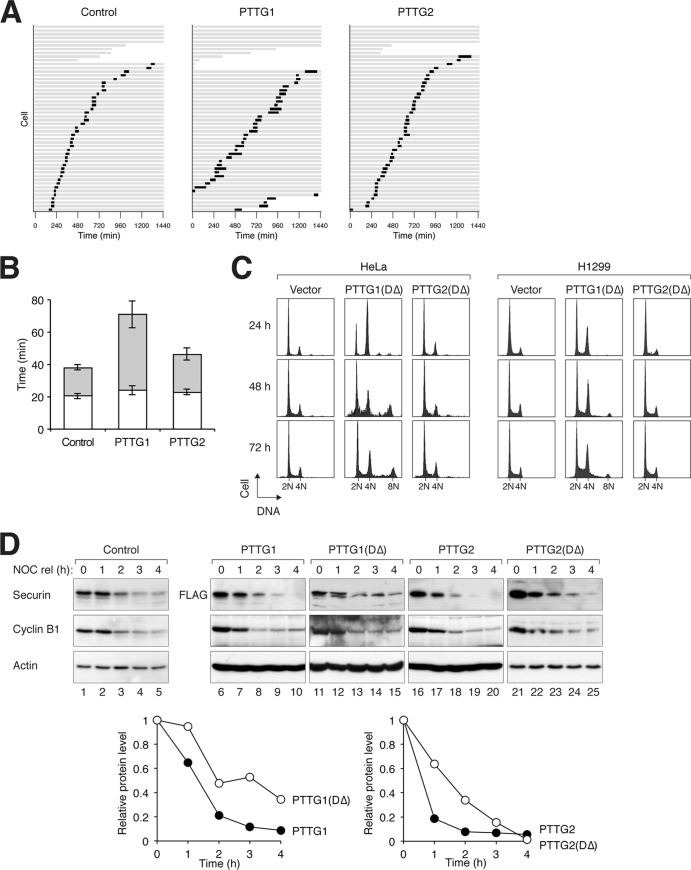
Fig 2.
Ectopic expression of PTTG2 does not affect the cell cycle. (A) Overexpression of PTTG1 but not PTTG2 prolongs mitosis. HeLa cells expressing histone H2B-GFP were transfected with control vector or plasmids expressing PTTG1 or PTTG2. Histone H2B-monomeric red fluorescent protein (mRFP) was used as a cotransfection marker. Individual cells were then tracked for 24 h with time-lapse microscopy. Each horizontal bar represents one cell (n = 50). Gray, interphase; black, mitosis (from DNA condensation to anaphase or cell death); truncated bars, cell death. (B) Anaphase onset is delayed in PTTG1-overexpressing cells. PTTG1- and PTTG2-transfected cells were analyzed as described for panel A. The duration of mitosis was quantified (mean ± 90% confidence interval). Mitosis was subdivided into two periods: from DNA condensation to metaphase (white) and from metaphase to anaphase (gray). (C) Nondegradable PTTG2 does not interfere with sister chromatid separation. PTTG1DΔ or PTTG2DΔ was expressed in HeLa or H1299 cells (a Tet-off clone). Histone H2B-GFP was used as a cotransfection marker. The cells were harvested at the indicated time points and analyzed by flow cytometry (only transfected cells were analyzed). (D) Mutation of the destruction sequences delays the degradation of PTTG1 and PTTG2. PTTG1DΔ was generated by mutation of the D box and the KEN box sequences of PTTG1. PTTG2DΔ was similarly generated by mutation of the D box (there is no KEN box in PTTG2) (Fig. 1A). FLAG-tagged PTTG1, PTTG1DΔ, PTTG2, or PTTG2DΔ was expressed in HeLa cells. The cells were synchronized at mitosis with a NOC block and released into the cell cycle by shaking off and washing. Doxycycline and cycloheximide were added to turn off the expression of the recombinant proteins. The cells were then harvested at the indicated time points. Lysates were prepared and analyzed by immunoblotting. Actin analysis was included to assess protein loading and transfer. The relative amounts of the proteins were also quantified using the Odyssey infrared imaging system (bottom). Actin signals were used to normalize the FLAG-tagged recombinant protein signals.

