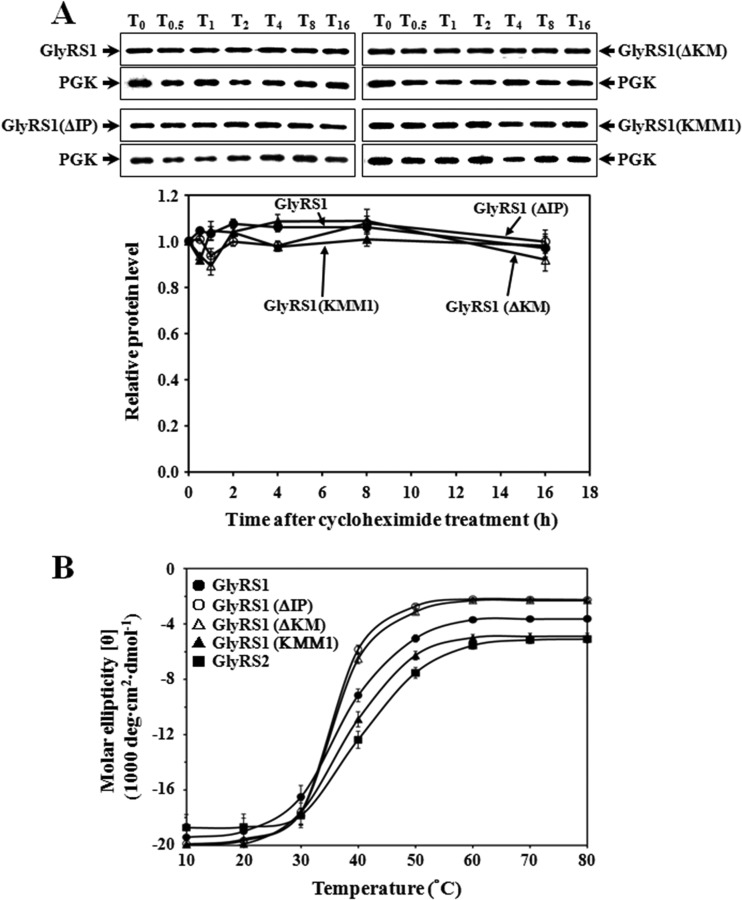
Fig 3.
Degradation and stability assays for GlyRS1 variants. (A) Cycloheximide chase assay. Transformants harboring various GRS1 constructs were grown in a raffinose-containing medium to a cell density of an A600 of ∼1.0 and then induced with galactose for 2 h before the addition of cycloheximide. Cells were harvested at various time periods following treatment with cycloheximide and lysed. T0, T0.5, T1, T2, T4, T8, and T16 denote 0, 0.5, 1, 2, 4, 8, and 16 h postinduction, respectively. PGK served as a loading control for each assay. Quantitative data for relative levels of GlyRSs are shown in a separate diagram below the Western blots. (B) The melting curves of the WT and mutant GlyRS1 enzymes. The melting curves of GlyRS1 and its mutants were determined via circular dichroism spectroscopy at 222 nm. The final concentration of the proteins was 2.4 μM. Spectra were recorded from 10°C to 80°C in a 1-mm-path-length cell on a Jasco J-810 spectropolarimeter using a scan speed of 50 nm per min, a time constant of 1 s, and a bandwidth of 1 nm. Three scans were accumulated and averaged for each protein tested.

