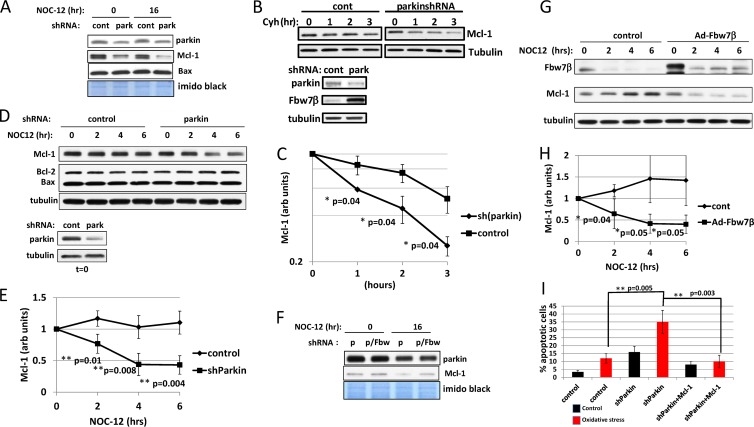
Fig 9.
Parkin regulates Mcl-1 levels through targeting of Fbw7β. (A) Regulation of Mcl-1 levels by parkin. Analysis of Mcl-1 levels after silencing of parkin and in response to oxidative stress was carried out. Protein samples are from the experiment described in the legend of Fig. 7A to C. Bax was also analyzed as a function of parkin silencing. (B) Cycloheximide chase analyzing Mcl-1 levels after silencing of parkin. Primary mouse neurons transduced with control or parkin-targeting shRNA adenovirus were treated with cycloheximide, and extracts prepared at the indicated times were analyzed by SDS-PAGE and Western blotting for Mcl-1 (upper panels). The zero time points were analyzed for parkin and Fbw7β (lower panels). (C) Quantitation using ImageJ of the experiment shown in panel B as well as an additional biological experiment. Mcl-1 was normalized to tubulin. (D) Silencing of parkin destabilizes Mcl-1 in response to oxidative stress. Extracts are from the same experiment shown in Fig. 6C. (E) Quantitation using ImageJ of experiment shown in panel D as well as two additional biological experiments. Mcl-1 was normalized to tubulin. (F) Silencing of Fbw7β rescues Mcl-1 levels after silencing of parkin. Protein samples are from same experiments described in the legend of Fig. 7A, B, and D. (G) Overexpression of Fbw7β destabilizes Mcl-1 in response to oxidative stress. Neurons transduced with control adenovirus or adenovirus expressing Fbw7β-Flag were treated with NOC-12 and analyzed at 2-h intervals for Fbw7β and Mcl-1 by SDS-PAGE and Western blotting. (H) Quantitation using ImageJ of the experiment shown in panel G as well as two additional biological experiments. Mcl-1 was normalized to tubulin. (I) Mcl-1 overexpression rescues the sensitivity to oxidative stress conferred by silencing of parkin. Neurons transduced with control adenovirus, shRNA adenovirus targeting parkin, or shRNA adenovirus targeting parkin simultaneously with an adenovirus expressing Mcl-1 were analyzed for NOC-12-induced apoptosis as described in the legend of Fig. 7. In all cases, error bars correspond to standard deviations, and P values were determined using Student's t test.

