
Fig 5.
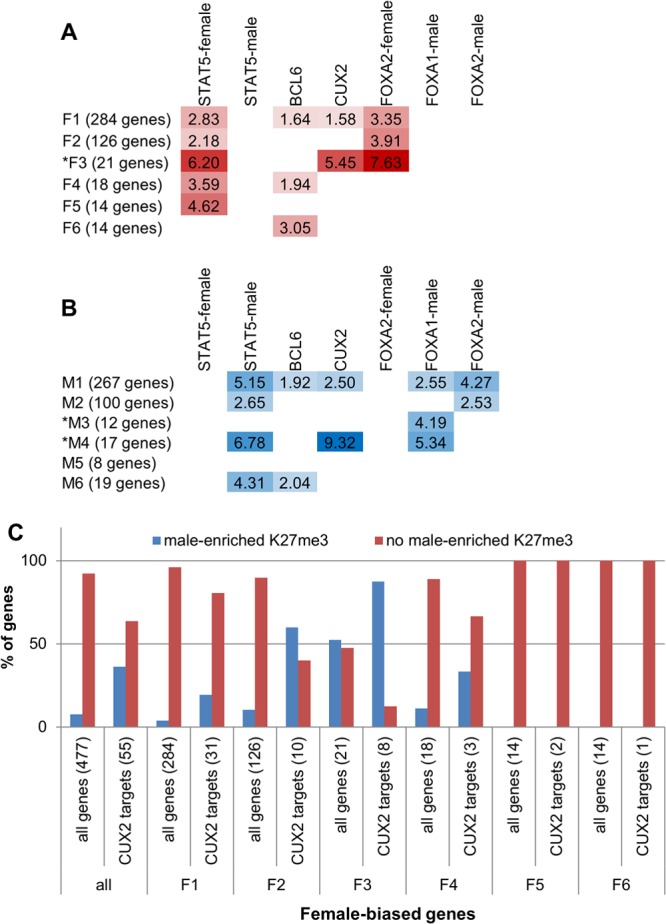
Enrichment of TF targets within each sex-biased gene class. (A and B) Fold enrichments for the genes in each class being a target of the specified TF (i.e., nearest gene within 10 kb of a TF binding site), compared to the background of all liver-expressed genes (see Materials and Methods). For both female-biased gene classes (A) and male-biased gene classes (B), data are shown for enrichments that have a P value of <0.05 and that contain at least five genes. Asterisks mark gene classes with sex-biased local chromatin marks (cf. Fig. 4A). For STAT5, FOXA1, and FOXA2, the enrichments shown are for targets of TF binding sites enriched in male or female liver, as indicated. No enrichments were seen for female-enriched FOXA1 binding. See Table S4B and C in the supplemental material for P values and numbers of genes represented by each enrichment score. (C) Percentage of CUX2 target genes in each female-biased gene class that overlap a male-enriched K27me3 mark compared to all female-biased genes in the class. Numbers of genes are shown in parentheses.