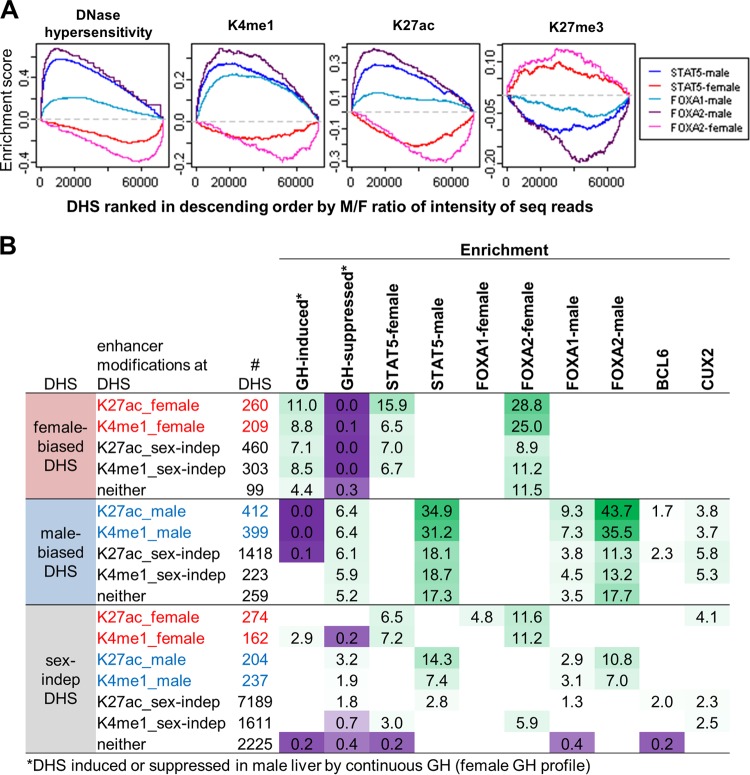
Fig 6.
Relationship between TF binding and sex bias in DHS and chromatin marks at regulatory sites. (A) Gene set enrichment analysis for DHS ranked by male/female (M/F) ratio in normalized sequence reads for each of the following (from left to right): DNase hypersensitivity, K4me1, K27ac, and K27me3. x axis, DHS ranked by M/F ratio in each mark, from male bias on left to female bias on right; y axis, running enrichment score for each TF. Male-enriched STAT5, FOXA1, and FOXA2 binding are enriched toward the male-biased (i.e., left) end of the ranked lists for DHS, K4me1, and K27ac and toward the female-biased (i.e., right) end of the ranked list for K27me3. The opposite pattern is seen for female-enriched STAT5 and FOXA2 binding. (B) Enrichment of ChIP-seq binding sites at male-biased, female-biased, and sex-independent DHS categorized by their patterns of enhancer-associated modifications (K27ac and K4me1). DHS are assigned enhancer categories in a hierarchical manner (see Materials and Methods). Sex-independent DHS shown are limited to those whose nearest gene TSS within 250 kb is sex biased in expression. Shown are enrichments and depletions at a P value of <0.001, and enriched groups were additionally required to contain at least five DHS. Green, enrichment; purple, depletion. Numbers of DHS and enrichment P values associated with these enrichment scores are shown in the upper sections of Table S6B to D in the supplemental material. Mapping of these DHS to the nearest gene TSS within 250 kb (to include more distal regulatory sites compared to the 10-kb distance used to map TF targets shown in Fig. 5) yielded enrichments for enhancer categories further broken down by the gene class of their target genes (see Table S6B to D).

