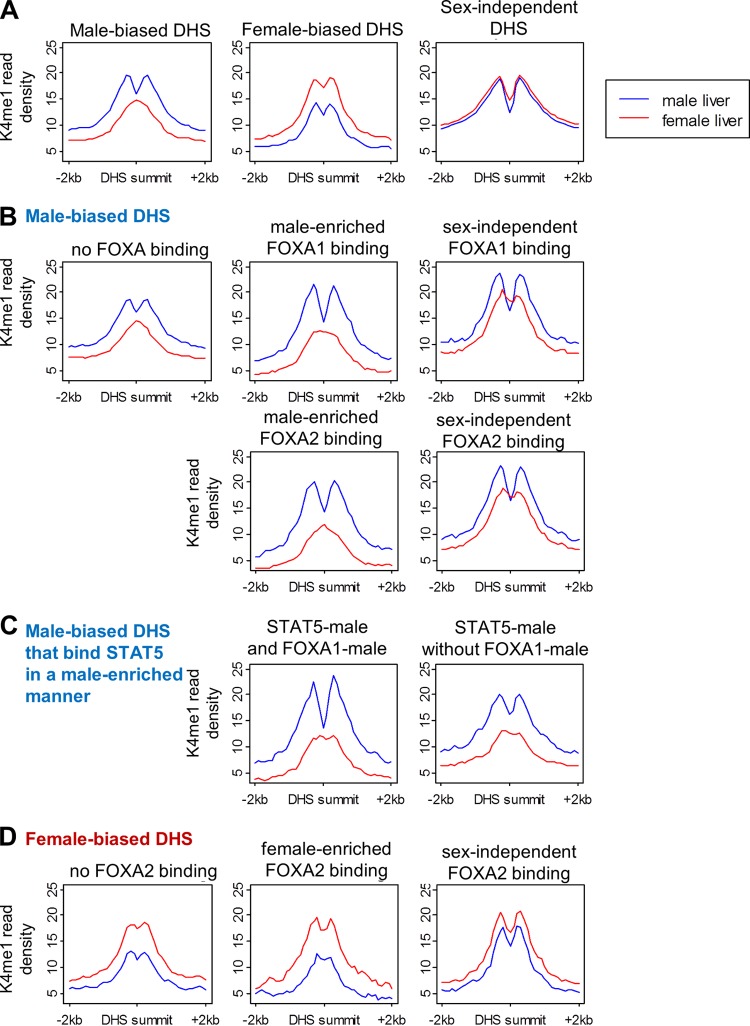
Fig 7.
K4me1 read profiles at DHS sites. K4me1 read density in male (blue) and female liver (red). Read counts are normalized to the total number of DHS in each panel. (A) Male-biased, female-biased, and sex-independent DHS. While male-biased DHS and female-biased DHS both show sex differences in K4me1 intensity (normalized read density), only male-biased DHS show a sex-dependent K4me1 distribution, with a monomodal peak in female liver and bimodal peak in male liver. (B) Male-biased DHS and FOXA1 or FOXA2 binding. (C) Male-biased DHS with male-enriched STAT5 binding, with and without FOXA1 binding. (D) Female-biased DHS and FOXA2 binding. The effect of STAT5 binding is shown in Fig. S10A to C in the supplemental material, and trough depths and sex differences in K4me1 profiles are quantified in Fig. S10D and E. The difference between the K4me1 profiles at FOXA-binding male-biased DHS and non-FOXA-binding DHS is retained when samples of non-FOXA-binding sites are chosen to match FOXA-binding sites by either DHS intensity or DHS sex ratio (see Fig. S10F to H).

