Abstract
Seminiferous tubules in mammals have histological arrangements defined by the associations between somatic cells and germ cells. The processes of DNA synthesis in meiotic and mitotic cells have different features that are not easily distinguishable through morphological means. In order to characterize the pre-meiotic S phase, 5-bromo-2’-deoxyuridine (BrdU) was injected intraperitoneally into Wistar rats, which were sacrificed 30 min, 2 hr, and 24 hr after injection. We found three different labeling patterns. One of these patterns was characterized by a distribution of the label in the form of speckles, most of which were associated with the nuclear envelope (labeling type I). We suggest that this pattern is due to mitotic DNA synthesis of type B spermatogonia. Labeling type II consisted of labeled foci scattered throughout the nuclear volume, which can be correlated with preleptotenic cells in pre-meiotic DNA synthesis. After 24 hr of incorporation, a third type of labeling, characterized by large speckles, was found to be related to cells in the “bouquet” stage; that is, cells in transition between the leptotene and zygotene phases. Our results indicate that BrdU incorporation induces different labeling patterns in the mitotic and pre-meiotic S phases and thus makes it possible to identify somatic and germinal cells.
Keywords: 5-bromo-2’-deoxyuridine, S phase, mitosis, meiosis, testis, chromatin
Introduction
The production of spermatozoa is ordered in time and space along the seminiferous tubules, with serial transversal sections of these tubules showing ordered sequential associations with spermatogenic cells. Germinal cells form concentric layers: the cells adjacent to the basal membrane are the least mature, and cell maturation increases from the periphery to the central channel of the seminiferous tubules (Hermo et al. 2010). In 1952, Leblond and Clermont described 14 cellular associations that correspond to the stages of germ cell development. Every four or five generations of germinal cells constitutes one stage. In stages I to VIII, it is possible to observe five cellular associations, whereas in stages IX to XIV, four cellular generations are present. In the rat, 14 different arrangements repeated along the tubule have been found (Leblond and Clermont 1952; Hermo et al. 2010).
The distance between two adjacent zones with the same association of spermatogenic cells is called a spermatogenic wave. The number of these associations and the duration of the cycle are constant in each species but vary among different mammals. In humans, for example, the duration of the cycle is about 16 days (Hermo et al. 2010).
In the periphery of the seminiferous tubules there are mitotic spermatogonia, which produce the meiotic primary spermatocytes that become secondary spermatocytes. In the nucleus of the cells that begin the prophase of the first meiotic division, synaptonemal complexes (SCs) are formed between homologous chromosomes. During the meiotic process, several specific proteins are expressed, including synaptonemal complex protein 3 (SYCP3, previously called SCP3). SYCP3 is a component of the lateral element of the synaptonemal complex (Heyting 1996) that is distributed differentially in distinct meiotic stages. In the pachytene stage, SYCP3 appears in the lateral element of the synaptonemal complex (Heyting et al. 1987).
The meiotic process begins in the G1 phase of a preleptotene spermatocyte and is followed by a pre-meiotic S phase (Watanabe et al. 2001) that is of longer duration than the mitotic S phase (Callan 1972; Lee and Amon 2001). In mice, the pre-meiotic (mitotic) S phase lasts about 20.6 hr, in rats 84.1 hr, and in humans about 62.4 hr (Adler 1996). These long S phases are probably required to establish the interhomologous relationships necessary for recombination and correct segregation of homologous chromosomes during the meiotic process (Lee and Amon 2001).
The objective of the present study was to determine the differences between the incorporation patterns of a DNA precursor, in this case BrdU, in the mitotic S phase and during the pre-meiotic S phase.
Materials and Methods
BrdU Incorporation
Twenty-seven adult male Wistar rats were used in this study. 5-bromo-2’-deoxyuridine (BrdU, Sigma, St Louis, MO) was injected intraperitoneally and the rats were sacrificed at 30 min, 2 hr, and 24 hr after injection. Following the manufacturer’s recommendation, the rats received 60 mg of BrdU/kg of bodyweight. After the established incorporation times, the testes were extracted and fixed. Intestinal tissue of the same rats was used as a control for the incorporation of the BrdU into non-germinal cells. Negative controls consisted of rats without BrdU injection. All animals were handled in accordance with the National Institutes of Health Guide for the Care and Use of Laboratory Animals.
Tissue Fixation
The testes and intestinal tissue were fixed for 24 hr in 2% paraformaldehyde (Baker; Phillipsburg, NJ) in a phosphate-buffered saline (PBS), then embedded in paraffin, sectioned at ~5 microns, and transferred to glass slides covered with poly-L-lysine (Sigma). The sections were later deparaffinized and rehydrated to carry out the different analyses. The general characteristics of the tissues were evaluated by staining the sections using the hematoxylin-eosin technique.
Hematoxylin and Eosin Staining
Deparaffinized tissue sections were incubated for 5 min in hematoxylin, washed in water for 2 min, treated with acid alcohol for 20 sec, submerged in an ammonia solution (NH3OH, 1%), washed in water for 1 min, placed in 80% ethanol for 1 min, immersed in eosin for 5 min, incubated twice in 95% ethanol for 2 min followed by 100% ethanol for 3 min and then finally submersed in xylol for 3 min. Finally, the slides were covered with permount.
BrdU Immunodetection
After removing the embedding medium, samples were incubated with 2N HCl at room temperature for 10 min to partially denature the cellular DNA and expose the incorporated BrdU. This was followed by neutralization in two washes of 0.1 M borate buffer at pH 8.5 for 15 min each. The tissue sections were washed in PBS and then incubated with polyclonal sheep BrdU primary antibody (Abcam, UK) at 1:100 in PBS for 1 hr at room temperature. After washing the slides with TBST (Tris 0.5 M, NaCl 0.3 M, Tween 0.1%) and PBS, they were incubated with Alexa Fluor 594 donkey anti-sheep secondary antibody (Invitrogen; Carlsbad, CA) at 1/200 in PBS for 1 hr in darkness at room temperature. These preparations were washed and counterstained with DAPI (Sigma) to evaluate DNA distribution. Finally, the slides were covered with mounting media for fluorescence microscopy (Vectashield Mounting Medium; Vector Labs, Burlingame, CA). The slides were observed under a Nikon Eclipse E600 Fluorescence Microscope equipped with a Digital Eclipse DXM 1200 high-resolution color digital camera with a resolution of up to 12 million pixels. The objectives used were 40X and 100X. The slides were observed using DAPI (EX 330-380, BA 455-485), red Texas (EX 540-580, BA 600-660), and FITC filters (EX 465-495, BA 515-555). The images were recorded and processed with the Adobe Photoshop CS5 program.
Simultaneous BrdU and Synaptonemal Complex Protein 3 Immunolocalization
Deparaffinized tissue sections were used to immunodetect incorporated BrdU and the SYCP3 protein. When the immunodetection of BrdU incorporation was complete, the immunolocalization of SYCP3 was performed. Sections were incubated with anti-SYCP3 (Affinity Bio Reagents; Golden, CO) (1:100) in PBS dilution for 1 hr at room temperature. After washing the slides with TBST and PBS, they were incubated for 1 hr in darkness at room temperature with an anti-rabbit immunoglobulin coupled to FITC (Jackson; West Grove, PA) diluted at 1/200 in PBS. To evaluate DNA distribution, the preparations were washed and counterstained with DAPI (Sigma). Finally, the slides were covered with mounting media for fluorescence microscopy (Vectashield Mounting Medium, Vector Labs). Tissue sections from rats not treated with BrdU were used to identify the SYCP3 protein, following the aforementioned protocol.
The slides were observed under a Zeiss Microscope Imager Z1 with an APOTOME Module and Software Axiovision Rel 4. The objectives used were Plan Neofluar 40x/1.30 Oil (dt = 0,2 mm), Plan Apochromat 63x/40 Oil (dt = 0,19 mm WO 8”), and Plan Neofluar 100x/1,30 Oil (dt = 0,20 mm). The filters used were FITC shift free, Exp 510, EM 515-565; 20 Rhodamin shift free Ex 560, EM 575-640; and DAPI shift free Ex 395, EM 445/50. The images were taken with a High Resolution Microscopy Camera AxioCam MRm Rev.2 (D) at a resolution of 1388 (H) × 1040 (V) = 1.4 Megapixels and processed with the Adobe Photoshop CS5 program.
Statistics
Thirty seminiferous tubules from six different rats from each treatment time were recorded with a digital camera, and all cells labeled with BrdU were counted. A one-way analysis of variance (ANOVA) was used to determine statistical significance (p<0.001). Statistical analysis was performed on all assays, and significant differences are noted in the graphical representations.
Results
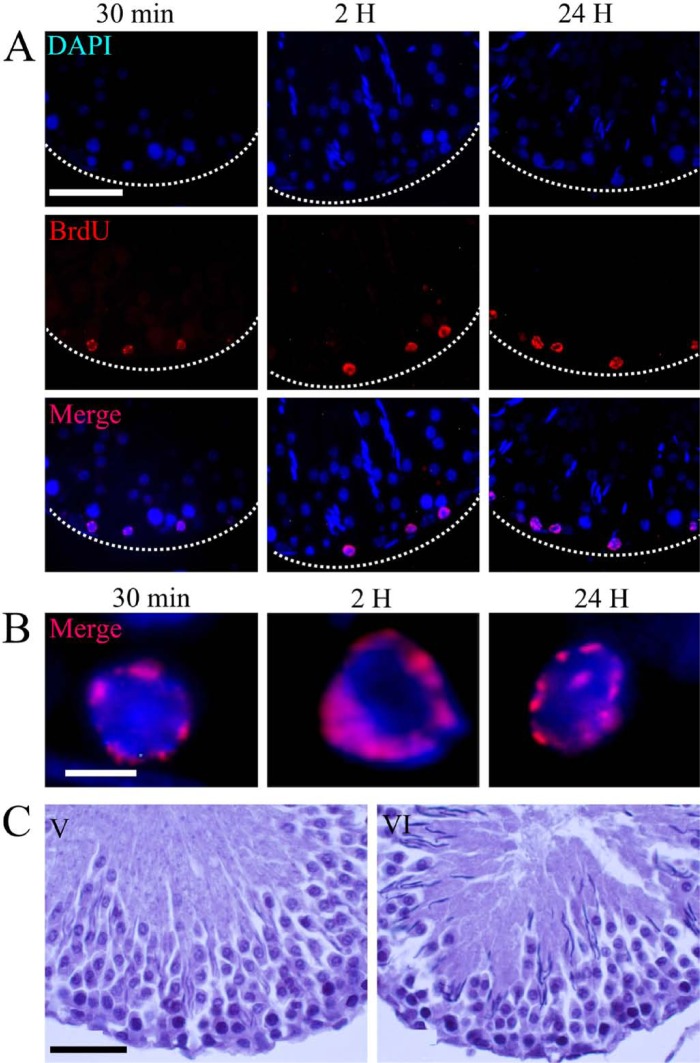
The patterns of BrdU incorporation were found to change in different cell types and at different stages of the spermatogenic wave. Three distinct distribution patterns of BrdU incorporation were found. The first label type was characterized by speckles associated with small clusters of compact chromatin located on the periphery of the nucleus. The presence and general distribution of the cells that were positive for BrdU incorporation in a seminiferous tubule are shown in Fig. 1A, where the positive cells are distributed close to the basal membrane of the tubule. At high magnification, it is possible to see that the label is associated with small clusters of compact chromatin (Fig. 1B). This pattern was seen at each interval evaluated in stages V and VI (Fig. 1C). Identification of the stages of this wave was performed with hematoxylin-eosin staining.
Figure 1.
Light micrographs showing transversal seminiferous tubules at 30 min, 2 hr, and 24 hr after BrdU injection. (A) BrdU-labeled cells are present at different times. DAPI shows the chromatin distribution. Cells positive for BrdU immunodetection have a pattern of labeled speckles located on the periphery of the nucleus. These labeled cells are close to the basal membrane of the tubules in stages V and VI of the spermatogenic cycle. (B) High magnification shows the specific distribution pattern of BrdU in the nuclei. This label is associated with small clusters of compact chromatin. (C) Hematoxylin-eosin staining shows the morphological characteristics of stages V and VI of the spermatogenic cycle. Dotted lines show the border of the seminiferous tubule. Scale bars: (A) 50 microns; (B) 5 microns; (C) 30 microns.
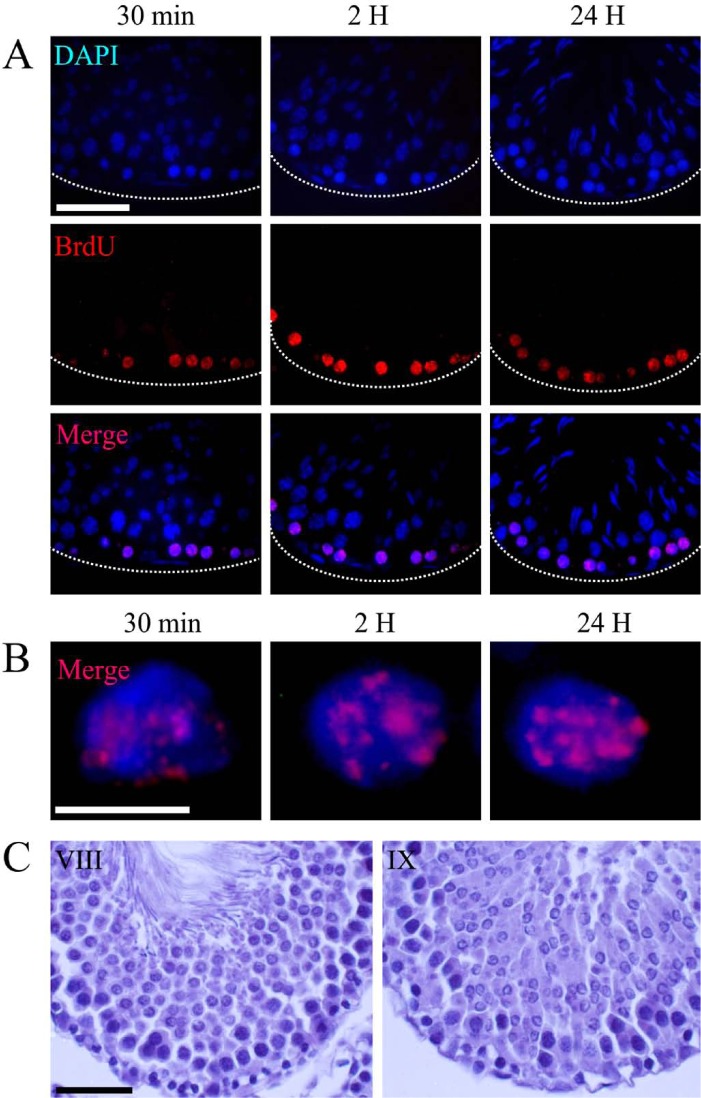
In addition, we found cells positive for BrdU incorporation in contact with the basal membrane of the seminiferous tubule (Fig. 2A), thus depicting a second distribution pattern of the labeling, characterized by foci scattered throughout the nuclear volume. High magnification images showed that the incorporated BrdU was associated with both loose and compact chromatin (Fig. 2B) in stages VIII and IX of the spermatogenic cycle (Fig. 2C).
Figure 2.
Light microscope micrographs showing type II labeling. (A) Panoramic view of transversal sections of seminiferous tubules showing the distribution of BrdU-labeled cells. The nuclear chromatin is evidenced by DAPI staining. Immunodetection of BrdU shows scattered foci, dispersed throughout the nuclear space. These positive sites were present at all incorporation times. The positive cells are those closest to the basal membrane of the seminiferous tubule and correspond to phases VIII and IX of the spermatogenic cycle (C). (B) High magnification shows the specific distribution pattern of BrdU in the nuclei. The localization of the positive staining is associated with loose and compact chromatin. Dotted lines show the border of the seminiferous tubule. Scale bars: (A) 50 microns; (B) 5 microns; (C) 30 microns.
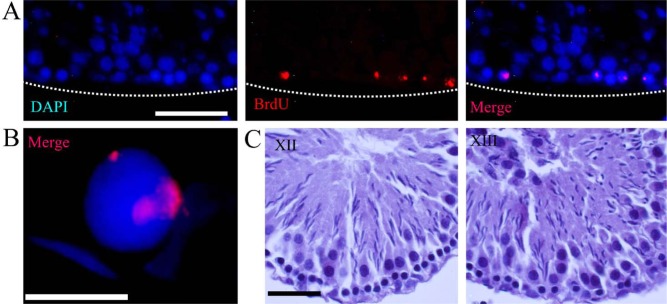
A third distribution pattern of labeling was found 24 hr after BrdU injection. In this case, the positive cells were in contact with the basal lamina (Fig. 3A). Observations under high magnification made it possible to identify this third type of labeling, which was characterized by large speckles frequently associated with clumps of compact chromatin (Fig. 3B). These cells were always in contact with the basal membrane of the tubule in stages XII and XIII of the cycle of the seminiferous tubules (Fig. 3C). Type I and type III labeling were seen in cells that are in contact with the basal lamina, outside the layer of spermatocytes in the pachytene stage of meiotic prophase (Fig. 3C).
Figure 3.
Type III BrdU incorporation pattern. (A) A panoramic view of several positive cells for BrdU immunodetection. This labeling pattern was found only 24 hr after BrdU incorporation and is characterized by large speckles. High magnification (B) shows the association of the label with compact chromatin. These cells are located close to the basal membrane of the seminiferous tubules belonging to stages XII and XIII (C). Dotted lines show the border of the seminiferous tubule. Scale bars: (A) 50 microns; (B) 10 microns; (C) 30 microns.
We quantified the BrdU-labeled cells in each time period observed. Our quantitative data revealed that the cells with type I labeling were present in similar amounts for the times evaluated (Fig. 4A), with no significant differences (p<0.001). The number of cells with type II labeling was significantly different in each evaluated time point (p<0.001). At 24 hr, type III labeling was present in a mean of 17.65 cells/seminiferous tubule. The total number of cells labeled with the different patterns identified in the present work increased with time: at 30 min, a mean of 51.44 cells/seminiferous tubule were labeled; at 2 hr, this increased to 66.74; and finally, at 24 hr, 75.98 cells were labeled (Fig. 4B). The difference between the quantity of labeled cells at 30 min and 24 hr was statistically significant (Fig. 4B).
Figure 4.
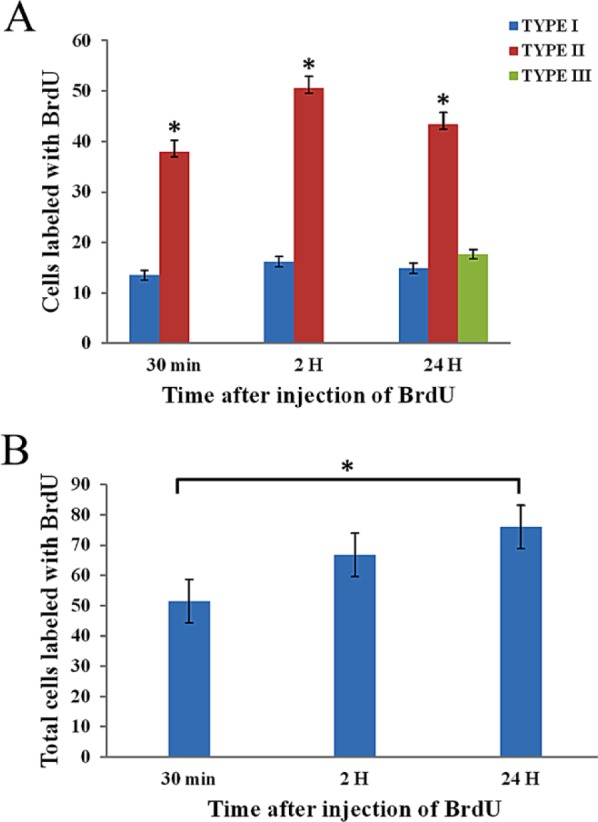
Quantitation of BrdU-labeled cells. (A) Cells from seminiferous tubules with the different patterns of BrdU labeling. The quantity of cells with type I labeling was the same across the times evaluated. The cells showing the type II labeling were significantly different among all three timepoints. (B) Total cells from seminiferous tubules labeled with BrdU. The amount of labeled cells was higher at the longer interval. There was a significant difference between 30 min and 24 hr of exposure to the BrdU. Error bars represent standard error and asterisks indicate significant differences obtained by an ANOVA test (p<0.001). H = hours.
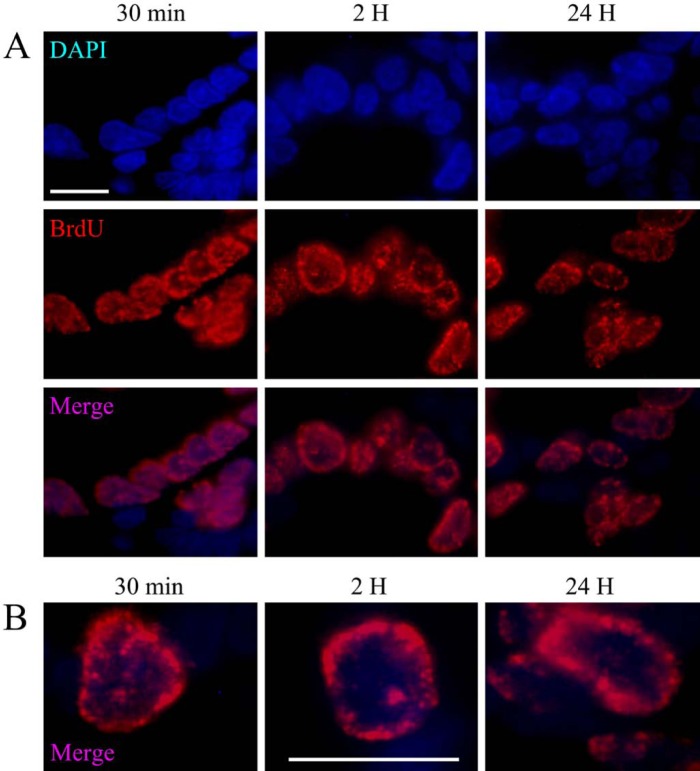
To corroborate that the type I staining pattern observed in spermatogonia B corresponds to the mitotic S phase, rat intestine epithelial cells were used as a model of classic somatic division. The pattern of BrdU incorporation in the intestinal cells during the S phase was found to be similar to that seen in spermatogonia B (Fig. 5A), and BrdU distribution was characterized by speckles associated with small clusters of compact chromatin on the periphery of the nucleus (Fig. 5B).
Figure 5.
(A) Immunodetection of BrdU in intestinal cells. The pattern of BrdU incorporation into these cells corresponds to type I, as the speckles are associated with compact chromatin. (B) High magnification of intestinal cells showing type I labeling, corresponding to the mitotic S phase. Scale bar: 10 microns.
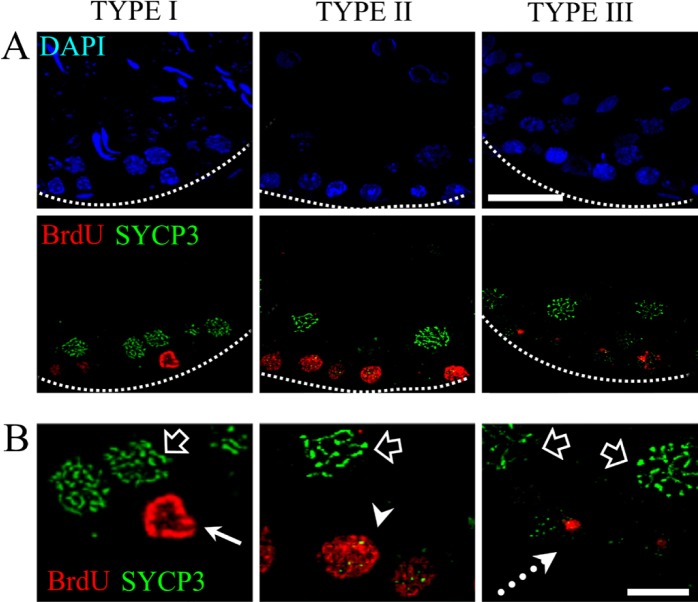
To confirm our classification of cells into mitotic S phase and pre-meiotic S phase cells, we carried out a specific immunodetection procedure for the meiotic SYCP3 protein (Fig. 6A). The double immunodetection of BrdU and SYCP3 allowed us to confirm that the type I pattern is present in spermatogonia B, since these cells were negative for SYCP3 immunodetection. The cells showing type II and type III patterns of BrdU incorporation corresponded to spermatocytes in the preleptotene stage and the initial meiotic prophase, since the immunodetection of SYCP3 co-localized with these patterns of BrdU incorporation. The labeling pattern for SYCP3 in the preleptotene phase is disperse because SYCP3 is a component of the lateral element of the synaptonemal complex, which is not assembled until the leptotene phase and becomes more evident during the zygotene. In the other cells, SYCP3 distribution is elongated in the form of axes, indicating cells in the pachytene stage (Fig. 6B).
Figure 6.
Double immunolocalization of BrdU and the SYCP3 protein. (A) Image displaying the three different patterns of BrdU incorporation. Type I corresponds to cells in the mitotic S phase that are not positive for the meiotic protein SYCP3, whereas the cells with pattern types II and III are positive for the SYCP3 protein. (B) High magnification of the three patterns described. The arrow shows a cell with pattern type I, which is negative for the SYCP3 protein. The arrowhead points to a double-labeled cell that is positive for SYCP3 and BrdU incorporation and corresponds to pattern type II. The dotted arrow shows a cell with pattern type III, which is simultaneously positive for the SYCP3 protein. Empty arrows point to cells that are positive for the SYCP3 protein and form filaments; these cells are in the pachytene stage. Dotted lines show the border of the seminiferous tubule. Scale bars: (A) 30 microns; (B) 10 microns.
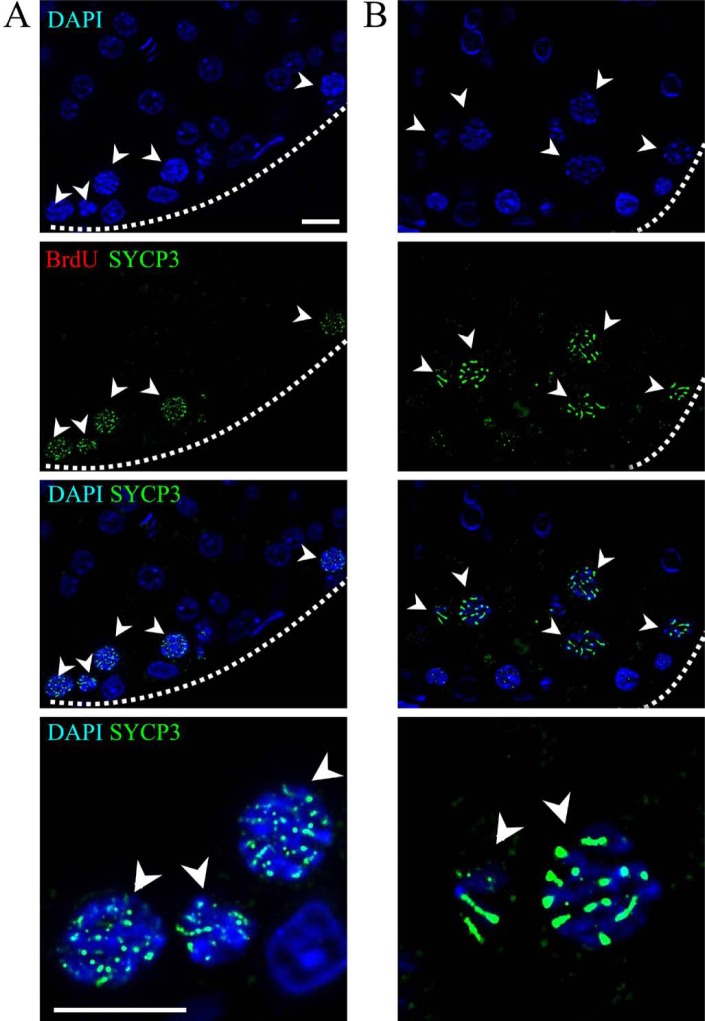
The presence of BrdU and the SYCP3 protein was evaluated in the control rats to account for non-specific BrdU detection. The control sections showed cells positive only for SYCP3 and negative for BrdU incorporation. Figure 7A shows primary spermatocytes in the preleptotene phase, where SYCP3 label distribution was dispersed in the nucleus. Once the cells reached the pachytene stage and the synaptonemal complex had been assembled, SYCP3 was associated with this structure (Fig. 7B).
Figure 7.
BrdU and SYCP3 protein immunodetections in control rats’ testes. Panoramic view showing cells positive for the SYCP3 protein in seminiferous tubules. In (A), the cells near the basal membrane are primary spermatocytes in the preleptotene phase, where SYCP3 distribution is dispersed in the nucleus, as the synaptonemal complex is not yet assembled (arrowheads). The positive cells in (B) are primary spermatocytes in the pachytene phase. The synaptonemal complex is now formed, as evidenced by the elongated pattern of SYCP3 (arrowheads). The cells are negative for BrdU immunodetection. Dotted lines show the border of the seminiferous tubule. Scale bar: 10 microns.
Discussion
The first studies of cell cycle and DNA synthesis in spermatogonia and spermatocytes used radioactive precursors of DNA, such as tritiated thymidine, the incorporation of which was revealed by autoradiography (Monesi 1962). But this technique requires longer exposure times to obtain a visible signal than the method based on BrdU incorporation. Furthermore, autoradiography leaves greater uncertainty regarding the relationship between the location of the radioactive atom and that of the affected BrAg crystal. Pioneering autoradiographic studies of DNA synthesis and the cell cycle using tritiated thymidine were carried out in mouse (Monesi 1962) and rat (Leblond and Clermont 1952) spermatogonia and spermatocytes.
In rats, the use of BrdU made it possible to calculate the duration of the cycle of the seminiferous tubules (Ehmcke, Simorangkir, and Schlatt 2005). It was also determined to be a useful method for evaluating cellular proliferation in somatic cells and the cell cycle in spermatogonia and spermatocytes (Monesi 1962). BrdU was used in this study to demonstrate well-defined areas of labeling, such as speckles, which clearly distinguish the nuclear regions that do not incorporate BrdU, thus permitting high resolution images.
During pre-mitotic and pre-meiotic DNA replication, the same replicative machinery and regulators are used (see the review in Marston and Amon 2004). In the present work, we developed a strategy to identify the mitotic and meiotic cells in a single tubule using the different patterns of BrdU incorporation that the cells exhibit after the pre-mitotic or pre-meiotic S phase. Three different patterns of staining were identified, depending on the time elapsed after BrdU incorporation.
Hence, this study proposes that type I labeling present at the different incorporation times during stages V and VI (Leblond and Clermont 1952; Hermo et al. 2010) corresponds to cells that are undergoing mitotic DNA synthesis, since they are type B spermatogonia.
Type II labeling was found in cells in the preleptotenic phase; that is, in cells that are undergoing pre-meiotic DNA synthesis during stages VIII and IX of the spermatogenic wave (Leblond and Clermont 1952; Hermo et al. 2010).
After 24 hr of incorporation, both types I and II labeling were present, but a third type of labeling also manifested, characterized by the presence of speckles. This is found in stages XII and XIII. As this third type was found only 24 hr after treatment, we propose that these cells incorporated the BrdU at the end of the pre-meiotic S phase and then had sufficient time to advance into the leptotene or zygotene stages. Since the length of the leptotene phase is 21.3 hr, the zygotene phase begins after this interval (Adler 1996); hence, BrdU incorporation during 24 hr provides sufficient time for the cells to incorporate BrdU at the end of the S phase and then transit to the next phases of meiotic prophase I.
The different patterns observed in this work do not depend on the time of BrdU incorporation, because the patterns corresponding to the mitotic S phase and pre-meiotic S phase can be observed from 30 min after exposure to BrdU up to 24 hr. This method made it possible to identify BrdU incorporated into the DNA during the S phase in small pulses of 30 min (Gratzner and Leif 1981). Observations have shown that BrdU incorporation can be detected several days after injection, with labeled cells are easily detectable even 8 days post-injection (Penit 1986).
In this work we injected male rats with a single dose of BrdU at 10 mM, and sacrificed the rats after 30 min, 2 hr, and 24 hr. We found three different labeling patterns, which were independent of the time after BrdU injection. Pattern types I and II were present at all three times, whereas the third pattern was found only in the rats sacrificed 24 hr after injection. Our observations indicate that under these conditions, the labeling patterns were similar at all three times but that the total number of labeled cells increased over time. The frequency of cells with type I labeling did not differ over the evaluated times; however, the frequency of cells with type II labeling was lower at 30 min. Finally, type III labeling appeared only after 24 hr post-exposure. The present experiment shows the cells labeled after the first uptake of BrdU. The 24 hr interval allowed us to identify not only type I staining pattern, which corresponds to the pre-mitotic S phase, and type II staining pattern, which is associated with the pre-meiotic S phase, but also a third type of labeling that is related to the transitional cells in the meiotic phase.
In this study, we used intestinal tissue to compare BrdU type I labeling (corresponding to the mitotic S phase) with the results from the testicular cells. The cells from the intestinal epithelium exhibited a high replication rate as their S-phase length was estimated at 9 to 13 hr (Potten, Schofield, and Lajtha 1979). We found that the pattern classified as mitotic S phase (type I) is the same in both organs: testes and the intestine.
Type I labeling is present in testes and intestinal cells at all times of BrdU incorporation, and the labeling pattern is similar in both cellular types. Although these are germinal and somatic cells, respectively, there were no differences in the labeling pattern. This strongly suggests that this is an effective technique for distinguishing between cells associated with the mitotic S phase and those with the pre-meiotic S phase. SYCP3 (previously called SCP3) has been localized in the axial elements of the synaptonemal complex, from the leptotene through the diplotene stages of meiotic prophase (Heyting et al. 1987, 1989); thus, this protein can be used as a marker of synapsed chromosomes where it is present in the lateral elements of the synaptonemal complex up to the end of the pachytene stage (Moens et al. 1998). The localization of SYCP3 allowed us to distinguish between the mitotic and meiotic cells, since the cells exhibiting type II labeling were positive for the meiotic marker, whereas the cells with type I labeling were negative for SYCP3 protein immunolocalization. The double immunolocalizations of BrdU and SYCP3 protein corroborate our previous statements, since the cells that were positive for the meiotic markers (SYCP3 protein) displayed type II and III labeling, which corresponded to meiotic labels.
The cellular associations in the testis have been established (Leblond and Clermont 1952), so it is well known that these cells are arranged in layers, with the basal ones being less differentiated and those in the lumen more differentiated. In this work, type A spermatogonia were observed and presented a BrdU type I incorporation (data not shown); however, it is important to mention that spermatogonia A are not difficult to identify, since they are larger than the other cells. This characteristic is taken into account to discriminate type A from type B cells without conferring confusing characteristics with other cellular types present in the seminiferous tubules.
The morphological characteristics of the cells and their associations established by Leblond and Clermont (1952) in the seminiferous tubule have been used as a criterion to distinguish between spermatogonia and spermatocytes; however, this requires great ability and visual experience to make an accurate diagnosis. This article presents strategies that make it possible to distinguish spermatogonia clearly from spermatocytes, even under experimental conditions that require cellular disaggregation. Hence, these results may also be useful as a tool for identifying cells in the mitotic S phase in male rats, as well as those in the pre-meiotic S phase.
Acknowledgments
The authors thank Ernestina Ubaldo Pérez for technical assistance. They also thank Paul C. Kersey Johnson for reviewing English usage and grammar.
Footnotes
Declaration of Conflicting Interests: The author(s) declared no potential conflicts of interest with respect to the research, authorship, and/or publication of this article.
Funding: The author(s) disclosed receipt of the following financial support for the research, authorship, and/or publication of this article: This work was supported by two grants: CONACYT 180526 and PAPIIT IN212912.
References
- Adler ID. 1996. Comparison of the duration of spermatogenesis between male rodents and humans. Mutat Res. 352(1–2): 169–172 [DOI] [PubMed] [Google Scholar]
- Callan HG. 1972. Replication of DNA in the chromosomes of eukaryotes. Soc Lond B Biol Sci. 181(62):19–41 [DOI] [PubMed] [Google Scholar]
- Ehmcke J, Simorangkir DR, Schlatt S. 2005. Identification of the starting point for spermatogenesis and characterization of the testicular stem cell in adult male rhesus monkeys. Hum Reprod. 20(5):1185–1193 [DOI] [PubMed] [Google Scholar]
- Gratzner HG, Leif RC. 1981. An immunofluorescence method for monitoring DNA synthesis by flow cytometry. Cytometry. 1:385–389 [DOI] [PubMed] [Google Scholar]
- Hermo L, Pelletier R, Cyr D, Smith C. 2010. Surfing the wave, cycle, life history, and genes/proteins expressed by testicular germ cells. Part 1: background to spermatogenesis, spermatogonia, and spermatocytes. Microsc Res Tech. 73(4):241–278 [DOI] [PubMed] [Google Scholar]
- Heyting C. 1996. Synaptonemal complexes structure and function. Curr Opin Cell Biol. 8:389–396 [DOI] [PubMed] [Google Scholar]
- Heyting C, Dietrich AJ, Moens PB, Offenberg HH, Redeker EJ, Vink AC. 1989. Synaptonemal complex proteins. Genome. 3(1):81–87 [DOI] [PubMed] [Google Scholar]
- Heyting C, Moens PB, van Raamsdonk W, Dietrich AJ, Vink AC, Redeker EJ. 1987. Identification of two major components of the lateral elements of synaptonemal complexes. Eur J Cell Biol. 43:148–154 [PubMed] [Google Scholar]
- Leblond CP, Clermont Y. 1952. Definition of the stages of the cycle of the seminiferous epithelium in the rat. Ann N Y Acad Sci. 55(4):548–573 [DOI] [PubMed] [Google Scholar]
- Lee B, Amon A. 2001. Meiosis: how to create a specialized cell cycle. Curr Opin Cell Biol. 13(6):770–777 [DOI] [PubMed] [Google Scholar]
- Marston AL, Amon A. 2004. Meiosis: cell-cycle controls shuffle and deal. Nature Rev Mol Cell Biol. 5(12):983–997 [DOI] [PubMed] [Google Scholar]
- Moens PB, Pearlman RE, Heng HHQ, Traut W. 1998. Chromosome cores and chromatin at meiotic prophase. Curr Topics Dev Biol. 37:241–262 [DOI] [PubMed] [Google Scholar]
- Monesi V. 1962. Autoradiographic study of DNA synthesis and the cell cycle in spermatogonia and spermatocytes of mouse testis using tritiated thymidine. J Cell Biol. 14:1–18 [DOI] [PMC free article] [PubMed] [Google Scholar]
- Penit C. 1986. In vivo thymocyte maturation. BUdR labeling of cycling thymocytes and phenotypic analysis of their progeny support the single lineage model. J Immunol. 137(7):2115–2121 [PubMed] [Google Scholar]
- Potten CS, Schofield R, Lajtha LG. 1979. A comparison of cell replacement in bone marrow, testis and three regions of surface epithelium. Biochim Biophys Acta. 560(2):281–299 [DOI] [PubMed] [Google Scholar]
- Watanabe Y, Yokobayashi S, Yamamoto M, Nurse P. 2001. Pre-meiotic S phase is linked to reductional chromosome segregation and recombination. Nature. 409(6818):359–363 [DOI] [PubMed] [Google Scholar]


