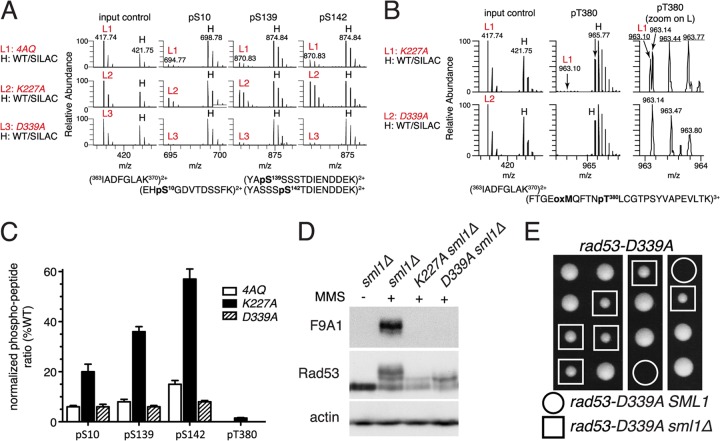
Fig 6.
The rad53-K227A mutant retains residual catalytic activity. (A and B) For mass spectrometry, samples were prepared from the indicated rad53 strains grown for 45 min after release from α-factor into YPD plus 0.05% MMS (“light” samples L1 to L3) and mixed with a “heavy” (H) stable isotope labeling with amino acids in cell culture (SILAC) reference sample of an unsynchronized isogenic strain (CAN1 arg4::KAN lys2::NAT) grown in minimal medium supplemented with l-lysine-13C6,15N2 and l-arginine-13C6,15N4 (Isotec) and treated with 0.05% MMS for 2 h (see Fig. S6 in the supplemental material for a schematic outline of the mass spectrometry procedure). Panel A shows precursor mass spectra of an unphosphorylated input control and spectra for the three phosphorylated Dun1 peptides indicated above. Note the similarity of peak heights of the three rad53 input controls (L1 to L3) to those of the heavy (H) reference sample but varying peak heights for the phosphopeptides in these rad53 strains compared to those of the same reference sample. Panel B shows precursor mass spectra of Dun1 T380 phosphorylation in the rad53-K227A or rad53-D339A sample (light) compared to those in the WT sample (heavy). The right panels are magnifications of the light samples in the middle panel; m/z values for correct Dun1 pT380-containing tryptic peptide ions are underlined. (C) Quantification of two independent MS/MS analyses of MMS-induced Dun1 phosphorylation in the indicated rad53 mutant strains. (D) Western blot analysis of Rad53 in the indicated strains with or without treatment with 0.05% MMS for 60 min. (E) Tetrad dissection of a RAD53/rad53-D339A SML1/sml1Δ diploid.

