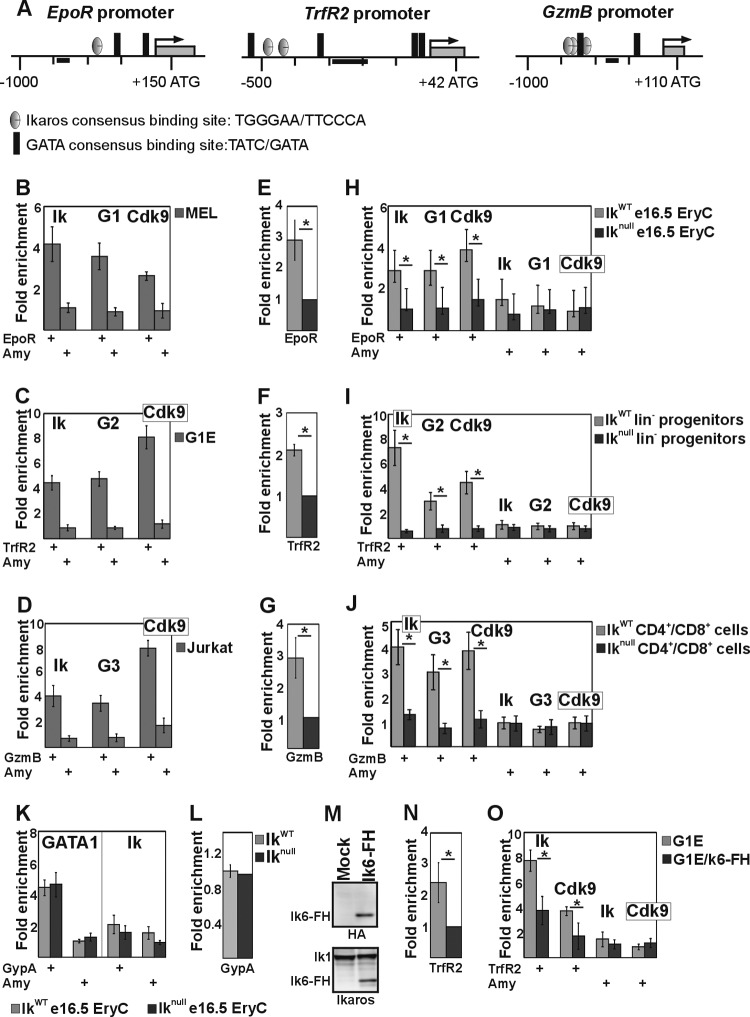
Fig 5.
Ikaros/Cdk9 and GATA proteins are transcriptional activators of several hematopoiesis-specific genes. (A) Schematic representation of the Erythropoietin receptor (EpoR), Transferrin receptor 2 (TrfR2), and Granzyme B (GzmB) murine promoters. Black bars, amplicons. (B to D, H to J, K, and O) ChIP assay results with MEL (B), G1E (C), Jurkat (D), and G1E cell lines carrying Flag- and HA-tagged Ik6 (O) or e16.5 fetal liver erythroid cells (e16.5 EryC [H and K]), bone marrow-derived lineage-negative progenitor cells (lin− [I]), or spleen-derived CD4+/CD8+ cells (J) purified from IkWT or Iknull mice. ChIP experiments were carried out with the antibodies indicated on the top of each panel. Ik, Ikaros; G1, G2, or G3, GATA1, -2, or -3. Immunoprecipitated and input chromatin samples were used as the templates for qPCR; quantification was carried out according to the 2−ΔΔCT method, using the mouse kidney-specific Tamm-Horsfall protein (Thp) promoter as an internal control. The fold enrichment values (y axis) for EpoR, TrfR2, GzmB, Glycophorin A (GypA), and Amylase (Amy) promoters relative to the control and the input samples are plotted as means and standard deviations. A value of 1 indicates no enrichment. *, P ≤ 0.05 by Student's t test (n ≥ 4). (E to G, L, and N) Quantitative RT-PCR results performed on equal numbers of cells. Mature transcripts were retrotranscribed with oligo(dT) primers; transcript quantification was performed according to the Pfaffl method (100) using specific qPCR primers and mouse Actin as an endogenous control. y axis, relative enrichment levels. The ratios are plotted as means ± standard deviations. *, P ≤ 0.05 by Student's t test (n ≥ 4). (M) Semiquantitative Western blot assay of total cell lysates of mock-transfected or Ik6-FH-transfected G1E cells. (Upper panel) Detection of Ik6-FH with HA antibody; (bottom panel) detection of endogenous Ik1and Ik6-FH with Ik antibody.

