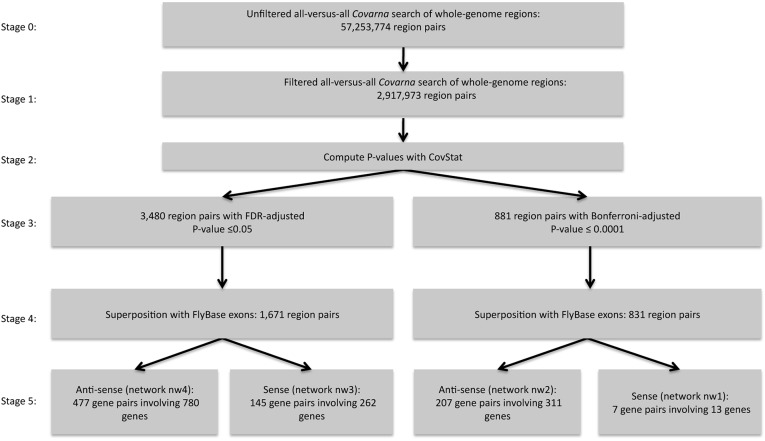
FIGURE 2.
Flowchart that depicts the various stages of data processing for identifying long-range nucleotide covariation. The involved steps are explained in the subsection “Data processing steps” (Materials and Methods). The sizes of the predicted networks corresponding to stage 5 relate to Table 1 in the following fashion: The sense networks (nw1 and nw3) appear in Table 1A. The antisense networks (nw2 and nw4) appear in Table 1B. The values corresponding to networks based on the False-Discovery-Rate correction (networks nw3 and nw4) appear in Table 1, A and B, in brackets. Note that the sum of predicted covariation relationships shown in Table 1, A and B, can be higher compared with the network sizes shown here, because a genomic region can be annotated with more than one feature simultaneously.

