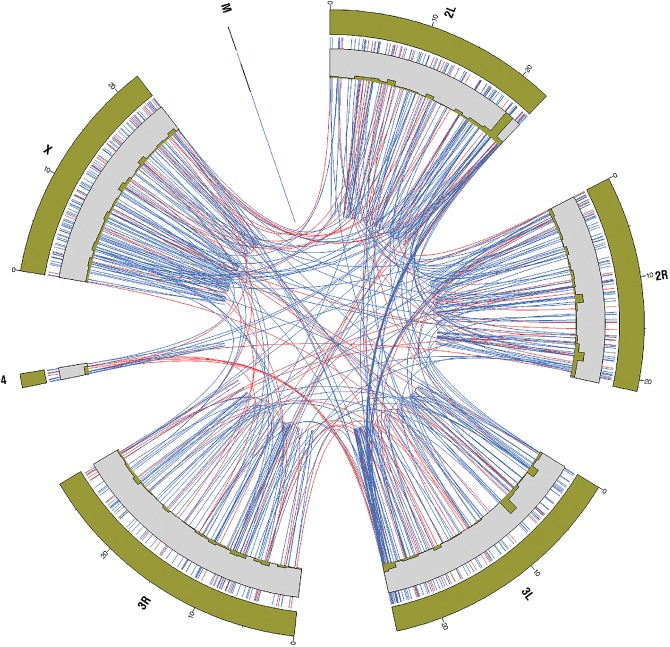
FIGURE 3.
Circular representation of detected covariation regions and their location with respect to the Drosophila melanogaster genome. Red connecting lines indicate the positions of reverse-complementary covariation between region pairs with the same strand directionality. Blue connecting lines indicate the positions of reverse-complementary covariation between region pairs with opposing strand directionality.

