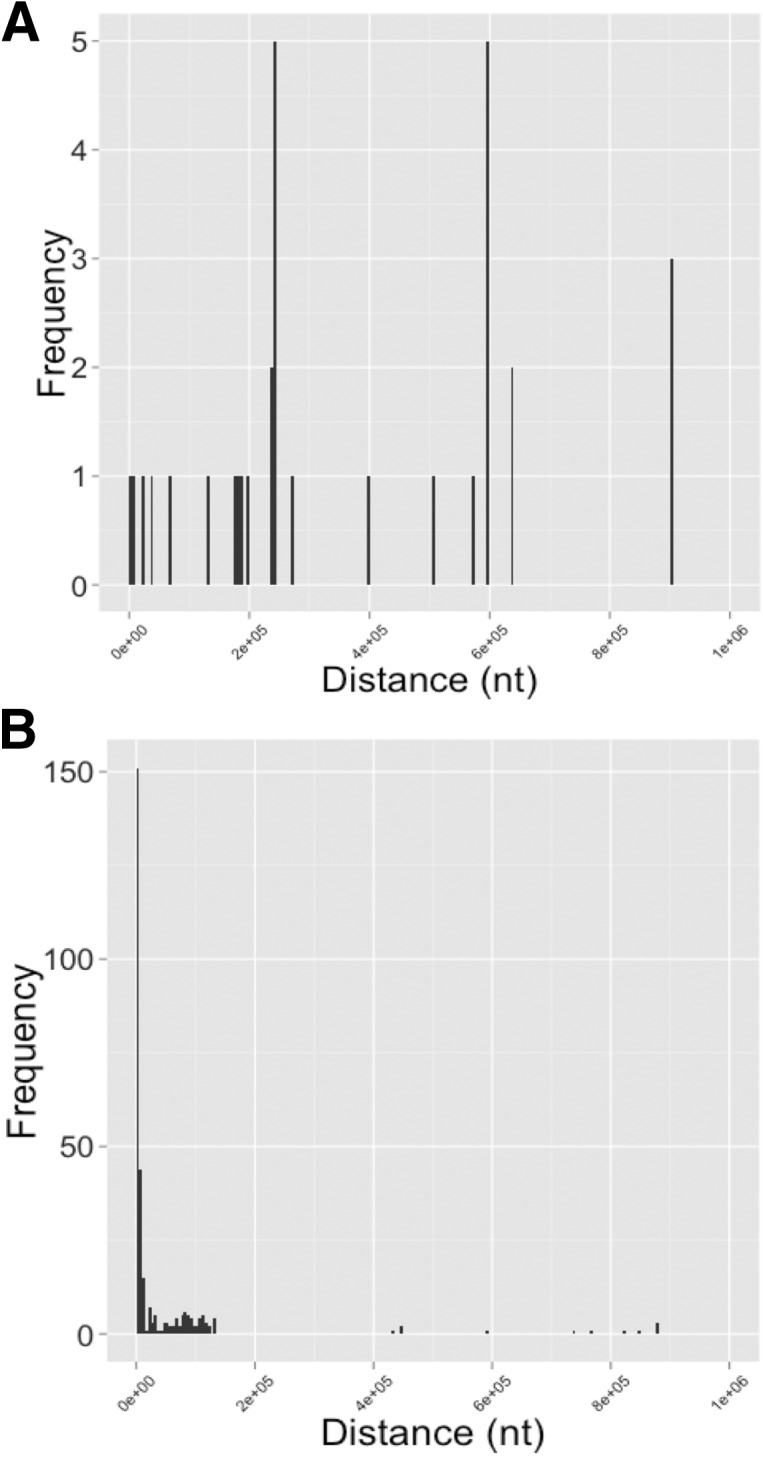
FIGURE 5.

Histograms showing various properties of detected long-range covariation. (A) Histogram of genomic distances between pairs of genomic regions with covariation corresponding to two genes. (B) Histogram of genomic distances between pairs of genomic regions with covariation corresponding to a gene and the antisense of another annotated gene.
