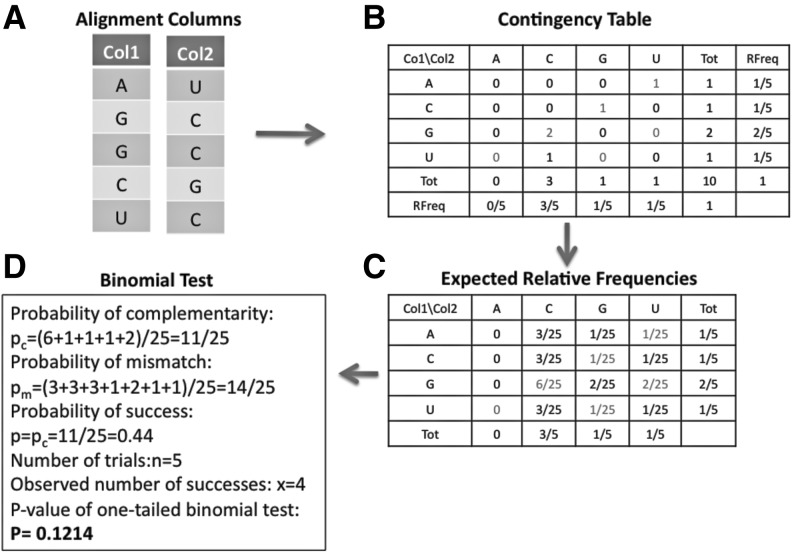
FIGURE 9.
Steps involved in computation of a statistical test for a bias toward complementary base pairs in two alignment columns. (A) Two alignment columns that are “input” for a statistical test that measures a bias toward dinucleotides that are complementary (AU, UA, CG, GC, GU, or UG). The number and identity of compared organisms corresponding to rows in the two columns must be identical. (B) A contingency table corresponding to counts of all 16 possible nucleotide pairings is computed. For example, the first row of the two alignment columns corresponds to a hypothesized “A-U” base-pair interaction. The column and row entitled “Tot” corresponds to the column-wise and row-wise sums, respectively. The column and row entitled “RFreq” corresponds to the relative frequency of that type of nucleotide in the first or second alignment column, respectively. (C) The expected relative frequencies of observing a certain nucleotide pairing are computed using the product of the per-column relative frequencies. (D) The information gathered in the previous steps is used to apply a one-tailed binomial test. The probability of observing a complementary nucleotide pairing by randomly picking a nucleotide from the first alignment column and a nucleotide from the second alignment column is the sum of the expected relative frequencies that correspond to the pairings AU, UA, CG, GC, GU, UG. The sum of those terms is pc= 0.44. This probability is used as the “probability of success” in the binomial test. The number of trials is set equal to the number of rows of the two alignment columns (n= 5). The number of observed successes among the five trials is x = 4, because for this example one observes the four complementary base-pairings AU, GC, GC, CG. A one-tailed binomial test with n = 5, P = 0.44, and x = 4 results in a P-value of 0.1214.

