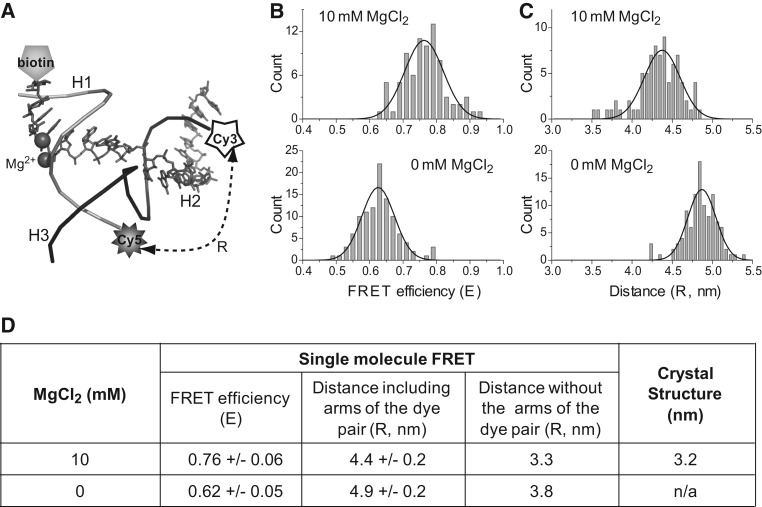
FIGURE 2.
Comparison of distances between the 3WJ H2/H3 distal ends derived from FRET measurements (with and without 10 mM MgCl2) and crystal data. (A) Location of labeling in 3WJ for single-molecule FRET study. (a3wj indicated by gray sticks; b3wj, black backbone; c3wj, gray backbone.) (B,C) Comparison of the FRET efficiency (B) and distance (C) at 0 mM and 10 mM Mg2+, respectively. The Gaussian curve fittings used to locate the peak of the distributions are shown as black lines. (D) Comparison of the distances from FRET and the crystal structure. The distance was corrected by subtracting the arm sizes of the fluorophore pair (Shu et al. 2010).

