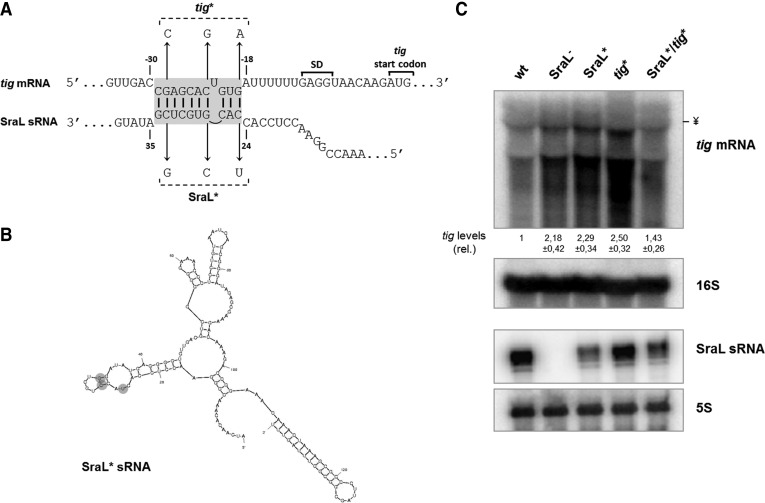
FIGURE 5.
Analysis of the interaction between SraL sRNA and tig mRNA. (A) Predicted interaction region between SraL sRNA and tig mRNA. The Shine-Dalgarno region and the start codon of tig are indicated. Chromosomal point mutations to generate SraL* and tig* alleles are indicated. (B) S. Typhimurium SraL* sRNA structure predicted by Mfold program (Zuker 2003). (C) Mutations in SraL and tig in the interaction region between both RNAs validate SraL–tig interaction. Total cellular RNA was extracted from the S. Typhimurium strains indicated grown in LB at 37°C until 6 h after OD600 of 2. (Upper panel) The expression level of tig mRNA was determined by using a 1.3% formaldehyde/Agarose gel. The amount of RNA in wild-type was set as one. The ratio between the RNA amount of each strain and the wild-type is represented (relative levels). A representative membrane is shown, and the values indicated correspond to the average of several Northern blot experiments with RNAs from at least two independent extractions. The membrane was stripped and then probed for 16S rRNA as loading control. The symbol ¥ in the picture indicated the position of the 16S rRNA. (Lower panel) Fifteen micrograms of RNA was separated on a 6% PAA/8.3 M urea to determine the expression level of both SraL and SraL*; probing of 5S rRNA was used as a loading control.

