
Fig 2.
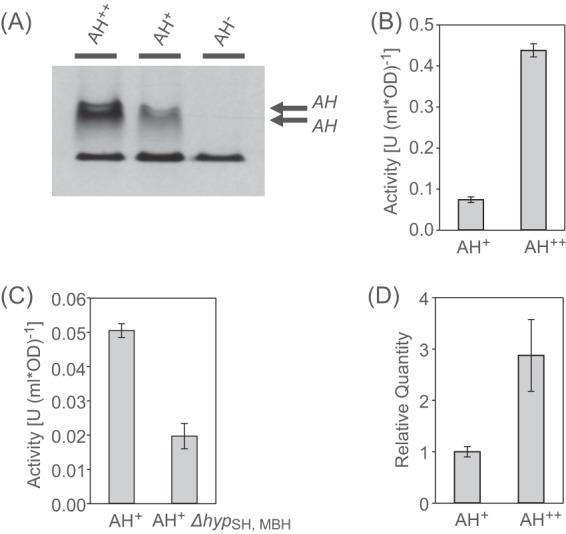
Activity of the R. eutropha AH. (A) Activities of the AH+ and AH++ strains, visualized by in-gel hydrogenase activity staining. Soluble cell extracts were separated electrophoretically in a native PAGE gel, which was subsequently incubated under H2. The reduction of NBT is documented by a dark blue color. The lower band in all lanes represents a H2-independent nonspecific reaction always present in R. eutropha soluble cell extracts. (B) In vivo H2 uptake activities of the AH+ and the AH++ strains. The hydrogen concentration in the headspace of different R. eutropha cultures was followed by gas chromatography, starting with 0.3% H2. (C) In vivo H2 uptake activities of the AH+ and the ΔhypSH, MBH cells. (D) Relative transcript quantities of the small subunit hofK in the AH+ and the AH++ cells as determined by RT-qPCR.