
Fig 3.
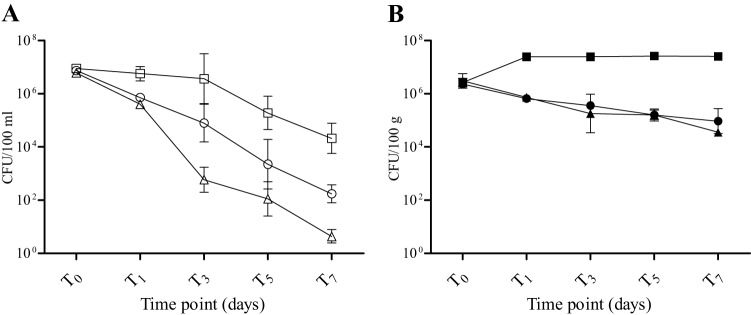
Mean E. coli concentrations over time in mesocosms with cycloheximide added (○ and ●), in the natural treatments (△ and ▲), and in disinfected controls (□ and ■) in the water column (A) and sediments (B). Data are means of log10-transformed values from five individual replicate mesocosms; error bars represent standard deviations. Shown are results from the September experiment.