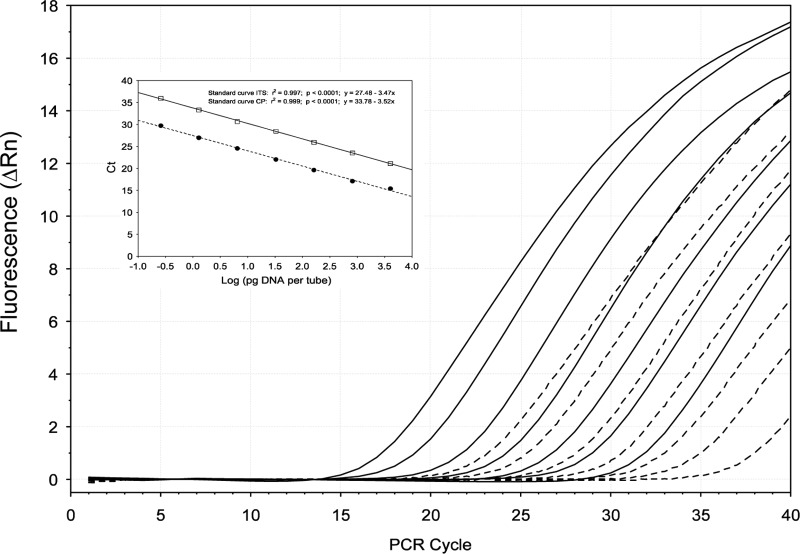
Fig 2.
Amplification plots of Ceratocystis platani DNA showing comparison between two different TaqMan MGB probes. The fluorescence (normalized reporter signal, Rn) of the TaqMan MGB probes for the CP target gene (broken line) appears later than the fluorescence of the probe designed for the ITS region (continuous lines). For each target gene, seven different 1:5 serial dilutions (ranged from 100 ng to 0.25 pg/tube) of C. platani strain Cp5 DNA were carried out. The inset shows the standard curves for the absolute quantification of C. platani using TaqMan MGB probes designed based on (i) the CP gene (broken line) and (ii) the ITS region (continuous line). Standard curves were generated by plotting threshold cycle (CT) numbers versus the logarithmic genomic DNA concentration of each dilution series.

