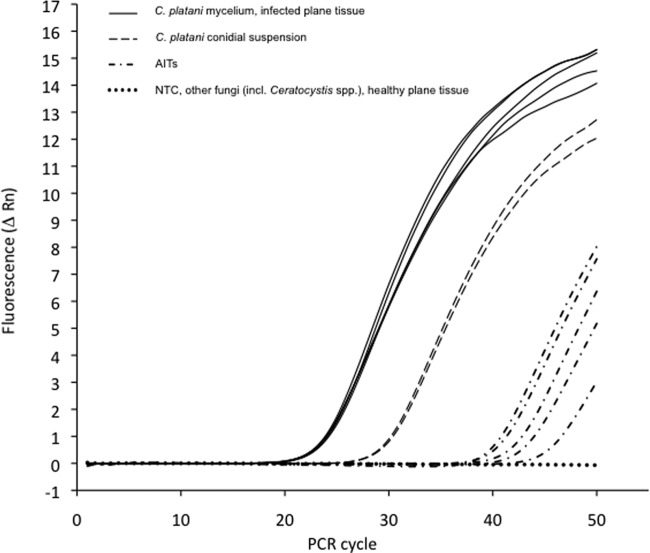
Fig 3.
Ceratocystis platani detection by TaqMan MGB probe on ITS2. Selection of amplification plots from different DNA samples: (i) C. platani mycelium and infected plane tissues (continuous lines), (ii) airborne inoculum traps (AITs) from sampling area (broken lines with dots), and (iii) C. platani conidial suspension (broken lines with long segments). The fluorescent signal (normalized reporter signal, Rn) was absent from the no-template control (NTC), from other Ceratocystis species and other fungi, and from healthy plane tissue (horizontal dotted line).

