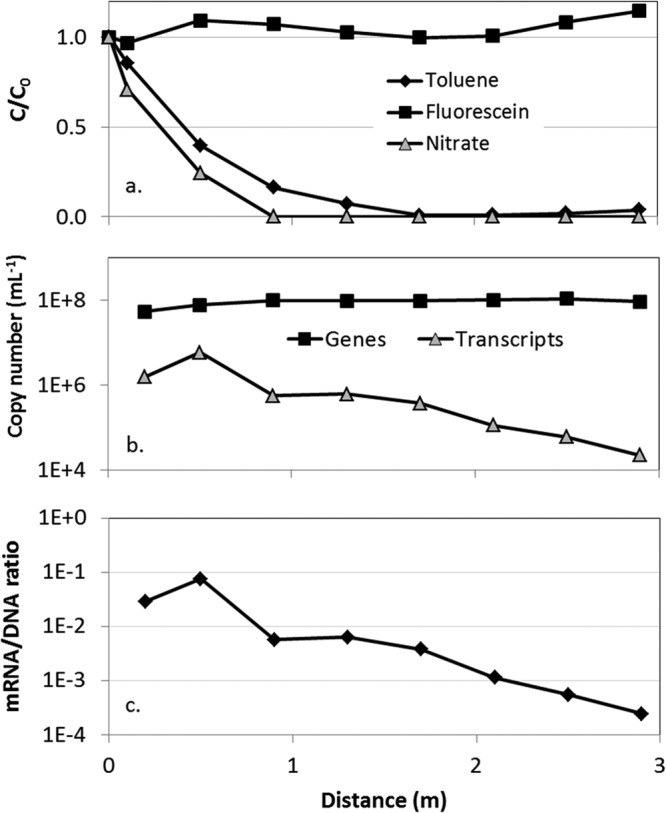
Fig 3.

(a) Relative abundance of toluene, nitrate, and fluorescein in pore water collected along the centerline of the plume downgradient of the injection port. Also shown are the abundances of bssA genes and gene transcripts (b) and the ratio of bssA transcripts to bssA genes (c). Error bars (in panel b) representing the standard deviation of 2 independent PCRs are smaller than the width of the symbols and therefore not visible. Toluene and nitrate concentrations used for normalization were 65 and 42 mg/liter, respectively.
