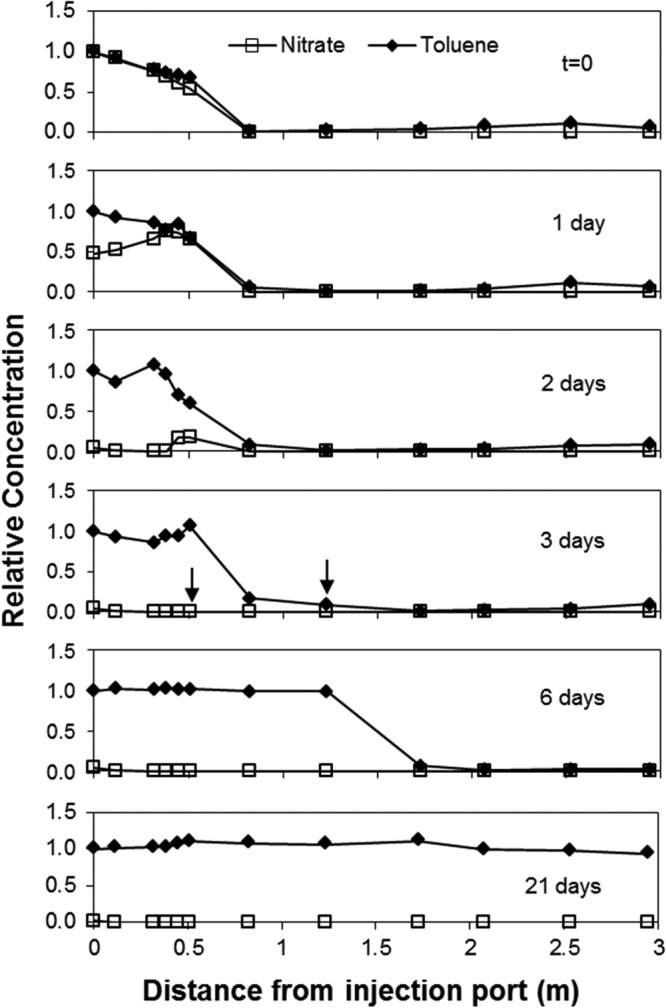
Fig 5.

Profiles of toluene and nitrate in the model aquifer following the termination of biostimulation with nitrate. Toluene data are presented relative to injection concentration. Nitrate data presented relative to injection concentration prior to termination. Arrows are present to indicate the points at which nitrate was no longer detectable and the leading edge of the toluene plume began to move. Toluene and nitrate concentrations used for normalization were 29.7 and 43.8 mg/liter, respectively.
