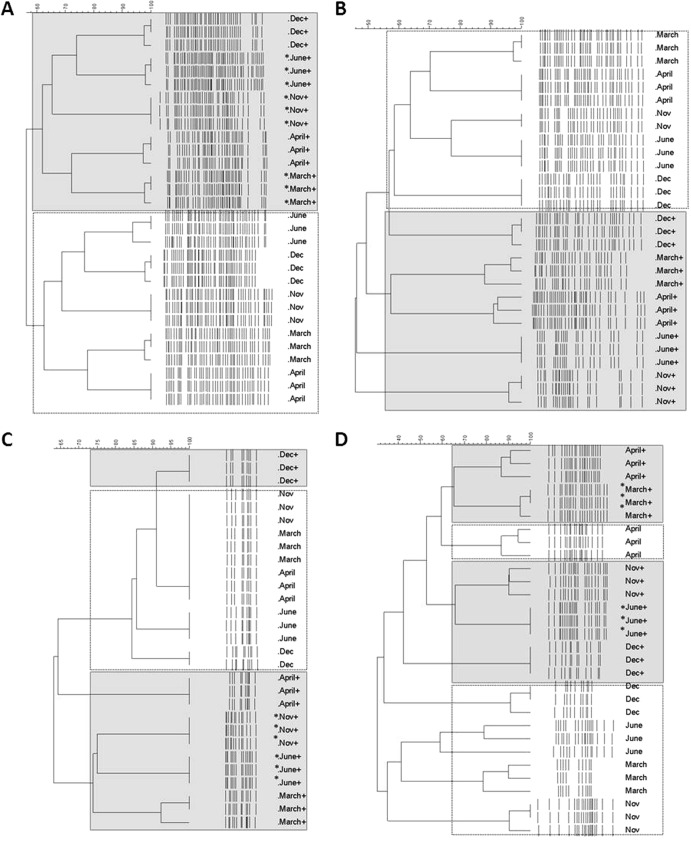
Fig 3.
Clustering of DGGE profiles based on UPGMA and Jaccard correlation coefficient. Shown are total bacteria (A), total fungi (B), Oxalobacteraceae (C), or Actinobacteria communities (D) in unamended and amended soils. Sampling time points of unamended soils, Dec-09, June-10, Nov-10, March-11, and April-12, are referred to as Dec, June, Nov, March, and April. Sampling time points of chitin-amended soils, Dec-09, June-10, Nov-10, March-11, and April-12, are referred as Dec+, June+, Nov+, March+, and April+. Sampling points indicated with “∗” were significantly different (P < 0.05).

