
Table 5.
Comparison of resistance and the MIC distribution (squashtogram) for Salmonella isolates from the conventional production system at farm and slaughtera
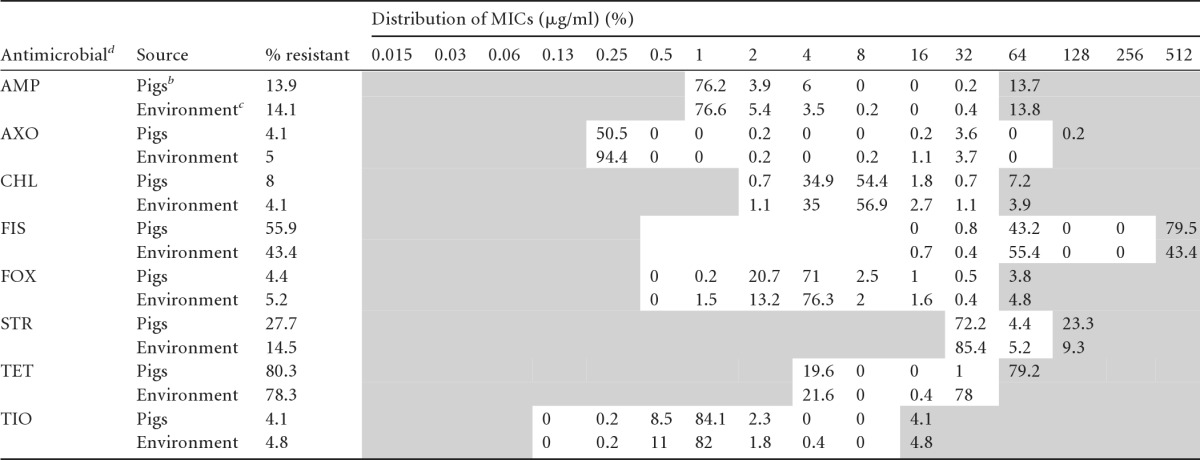
Pigs, n = 386; environment, t n = 536. Areas with white backgrounds indicate the range of dilutions tested for each antimicrobial. Shaded areas fall outside the range of tested concentrations. The vertical bars indicate the CLSI or NARMS consensus breakpoints for resistance (R versus I and S combined). Numbers in the right-side shaded areas indicate the percentages of isolates with undetermined MICs known to be greater than the highest concentrations measured on the broth microdilution plates.
Pigs includes isolates from conventional pig fecal samples (n = 189) at the farm and carcass samples (n = 197) at slaughter.
Environment includes isolates from conventional farm (n = 439) and slaughter (n = 97) environments.
AMI, amikacin; AMP, ampicillin; AXO, ceftriaxone; CHL, chloramphenicol; FIS, sulfisoxazole; FOX, cefoxitin; STR, streptomycin; TET, tetracycline; TIO, ceftiofur.