
Fig 3.
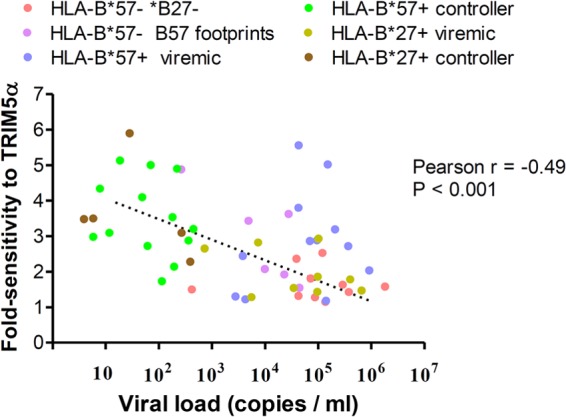
Correlation between viral sensitivity to hTRIM5α and viral load. Viral fold sensitivity to hTRIM5α was measured as described in the Fig. 1 legend and is plotted against plasma viral load measured at the time plasma used to amplify CA sequences was obtained. Analysis was restricted to patients not receiving antiretroviral therapy. Symbols are color coded according to the patient groups indicated in the figure and described in the Fig. 1 legend.