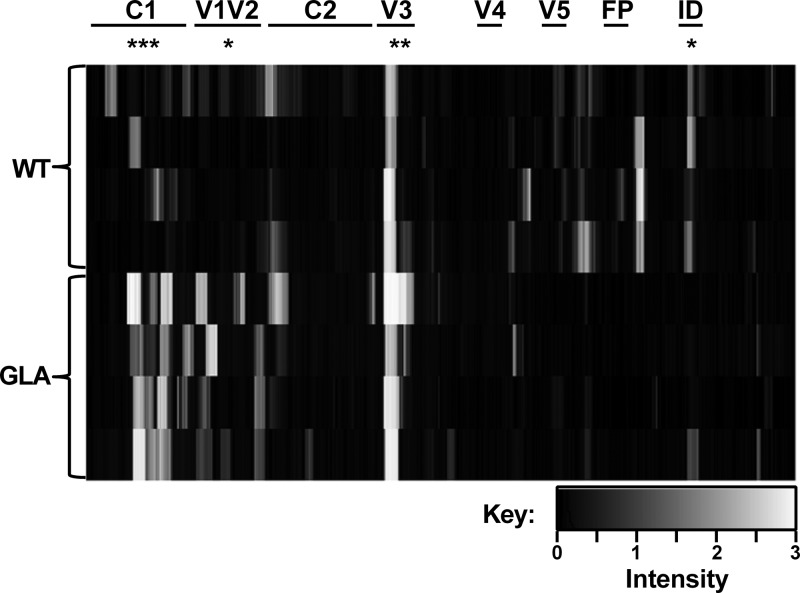
Fig 5.
Peptide scanning of week 24 serum responses. Binding of sera to 15-mer peptides (n = 4 per group) was tested by peptide array. Binding intensity is plotted in arbitrary units. Regions of gp140 are marked at the top. Statistical analysis for individual regions was performed by one-way ANOVA with Bonferroni's posttest. *, P < 0.05; **, P < 0.01; ***, P < 0.001.

