
Fig 5.
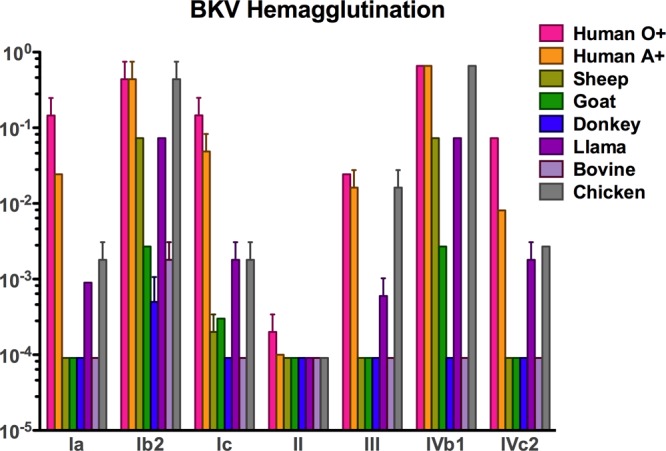
Hemagglutination by BKV variants. Bar graphs express the inverse of the last amount (in ng/ml) of VP1 VLPs that was able to hemagglutinate a 0.5% solution of red blood cells from the animal species indicated.
Official websites use .gov
A
.gov website belongs to an official
government organization in the United States.
Secure .gov websites use HTTPS
A lock (
) or https:// means you've safely
connected to the .gov website. Share sensitive
information only on official, secure websites.
Hemagglutination by BKV variants. Bar graphs express the inverse of the last amount (in ng/ml) of VP1 VLPs that was able to hemagglutinate a 0.5% solution of red blood cells from the animal species indicated.