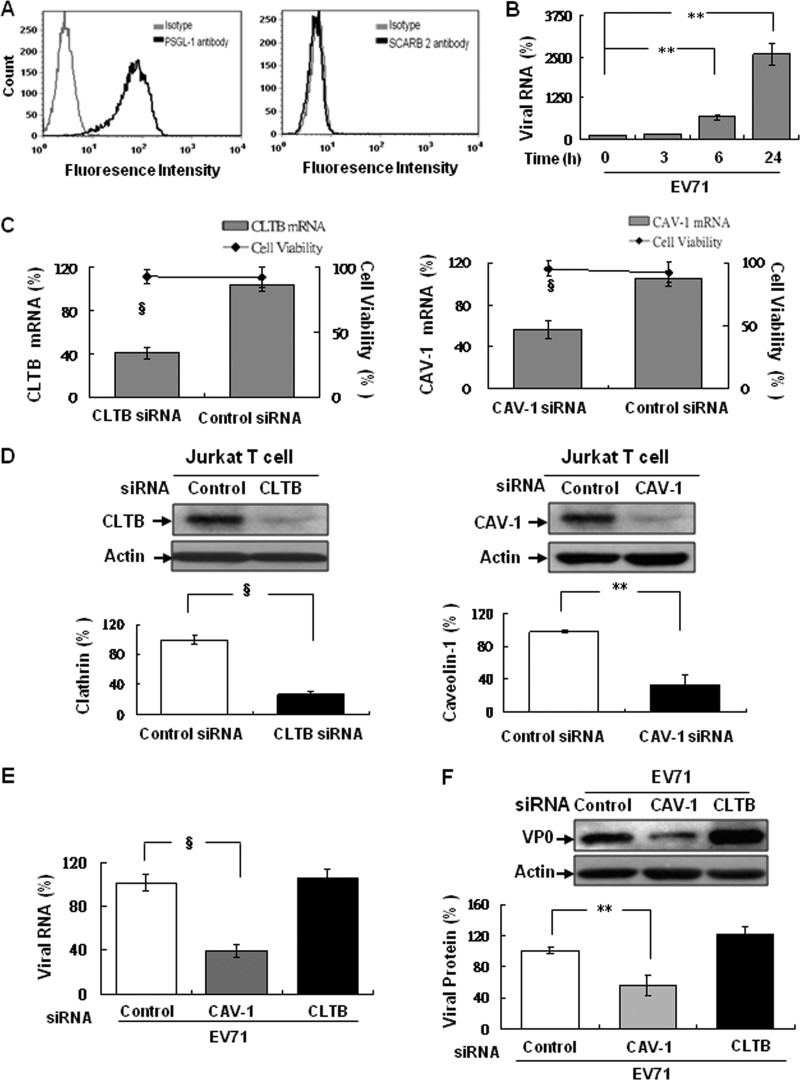
Fig 8.
EV71 infection is caveola dependent in Jurkat T lymphocytes. (A) The Jurkat T cells were incubated with biotinylated anti-SCARB2 antiserum or anti-PSGL-1 antiserum (black curve) prior stained with FITC-conjugated avidin or anti-mouse antibody, respectively. The Jurkat T cells incubated with the respective isotype IgG (gray curve) as controls were included. Stained cells were suspended in 1× PBS before run on a FACScan flow cytometer and analyzed using FCS Express V3 (De Novo Software). (B) Cells were infected with EV71 (MOI = 0.05) and then cultured at 37°C for additional incubation from 0, 0.5, 1, 3, 6, and 24 h. Total RNA were extracted at each time point postinfection and used to detect the viral RNA by real-time RT-PCR as described previously. Cells were transfected with 100 pmol of human CLTB-, CAV-1-specific siRNA or control siRNA and then cultured at 37°C for 48 h. After incubation, total RNAs were isolated to assay clathrin or caveolin-1 mRNA by real-time RT-PCR using the respective primers (Table 1) (C) and protein expression by immunoblotting with anti-clathrin or anti-caveolin-1 antibody (D). Changes in clathrin or caveolin-1 expression were compared to the expression in control siRNA-transfected cells (as 100%). After EV71 (MOI = 0.05) infection, total RNA and lysates were prepared at 24 h postinfection to detect viral RNA (E) and capsid proteins (F) as described previously. The mean relative expression of RNA and protein levels of clathrin, caveolin-1, and EV71 were calculated as described previously. The cellular β-actin detected as internal control for the findings shown in panels E and F was included. The data were quantified using Image-Pro Plus 6.0 software. Three independent experiments were performed, and one of them were shown.

