Fig 10.
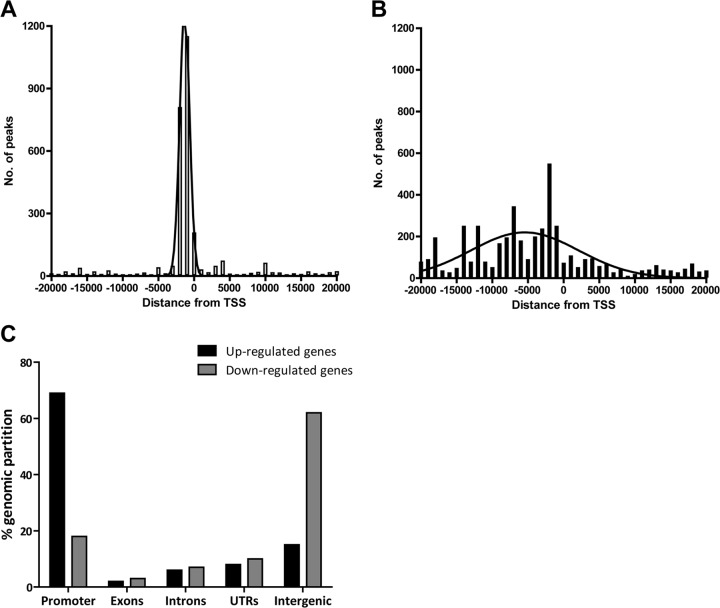
Differential location of Meq binding sites in up- and downregulated genes. Combination of ChIP-seq data and gene expression analysis reveals a distinct localization of Meq peaks in up- and downregulated genes. Frequency distribution of Meq binding sites relative to the nearest TSS, represented in 1-kb intervals for a distance covering 20 kb in upregulated (A) and downregulated (B) genes. (C) Relative occupancy of Meq in genomic regions in upregulated and downregulated genes (P < 0.001 compared to relative distributions in control regions by the χ2 test).

