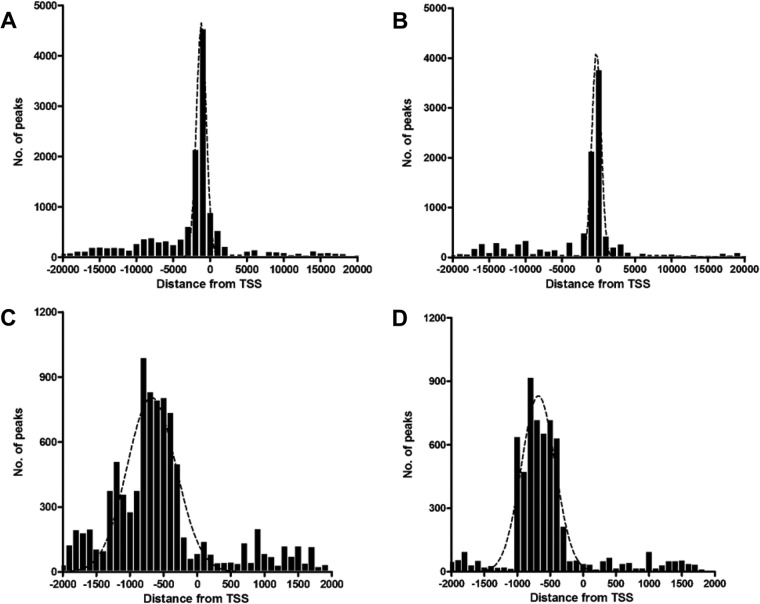
Fig 2.
Distribution of Meq and c-Jun binding sites. (A and B) The distances between Meq (A) and c-Jun (B) binding sites and the nearest TSS within ±20 kb are shown with the results binned in 1,000-bp intervals. (C and D) A more detailed view of the majority of binding sites that were within ±2 kb of the TSS shows the frequency distribution of Meq (C) and c-Jun (D) binding sites in 100-bp intervals. The black dotted line represents a polynomial line of best fit.

