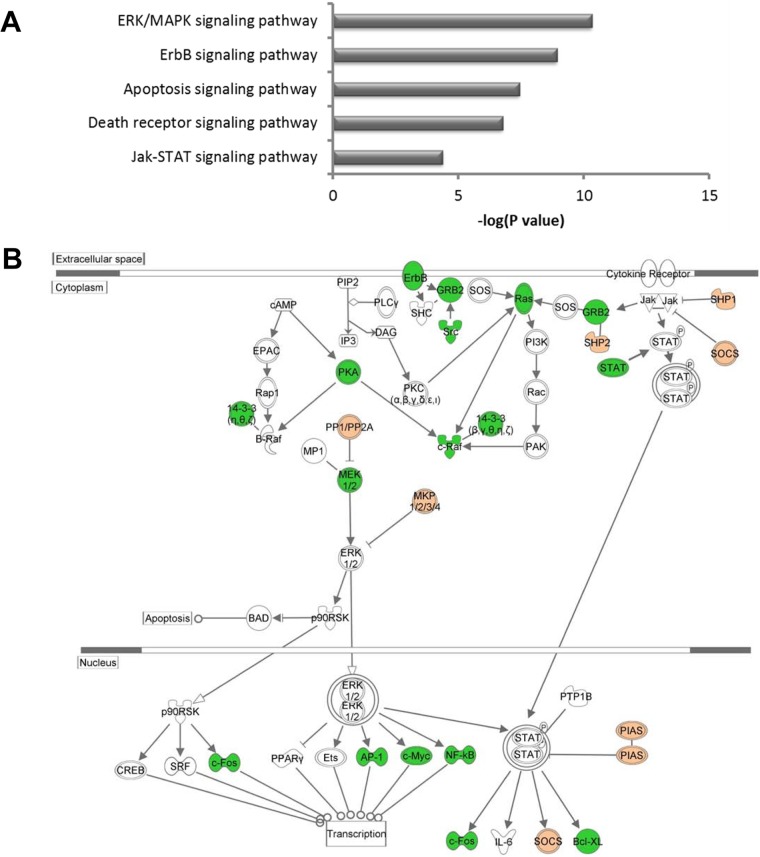
Fig 7.
Pathway analysis of Meq-regulated genes. (A) Top 5 functional classifications based on canonical pathway analysis of differentially expressed genes with significant [−log (P value) less than −1.3)] Meq binding sites using Ingenuity Pathway Analysis. (B) Overview of ERK/MAPK, Jak-STAT, and ErbB signaling pathways; the up- and downregulated genes are highlighted in green and red, respectively.

