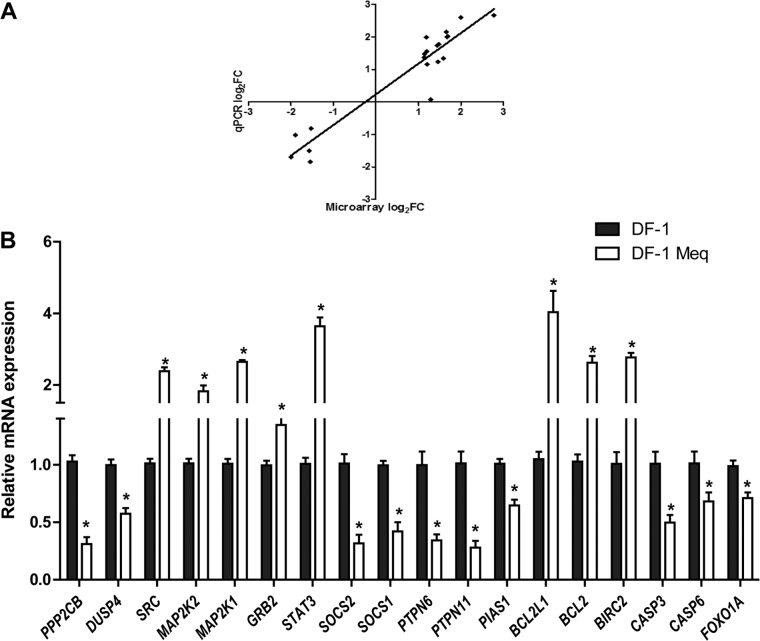
Fig 8.
Comparison of gene expression through microarrays and qRT-PCR. (A) Correlation plot comparing differential gene expression using microarray analysis to qRT-PCR data on a subset of 20 genes in the Meq-DF-1 cell line. (B) qRT-PCR validation of microarray results of the microarray-based differentially expressed genes between Meq-DF-1 and DF-1 cells. Beta-actin was used as internal control; *, P < 0.05 compared to DF-1 cells.

