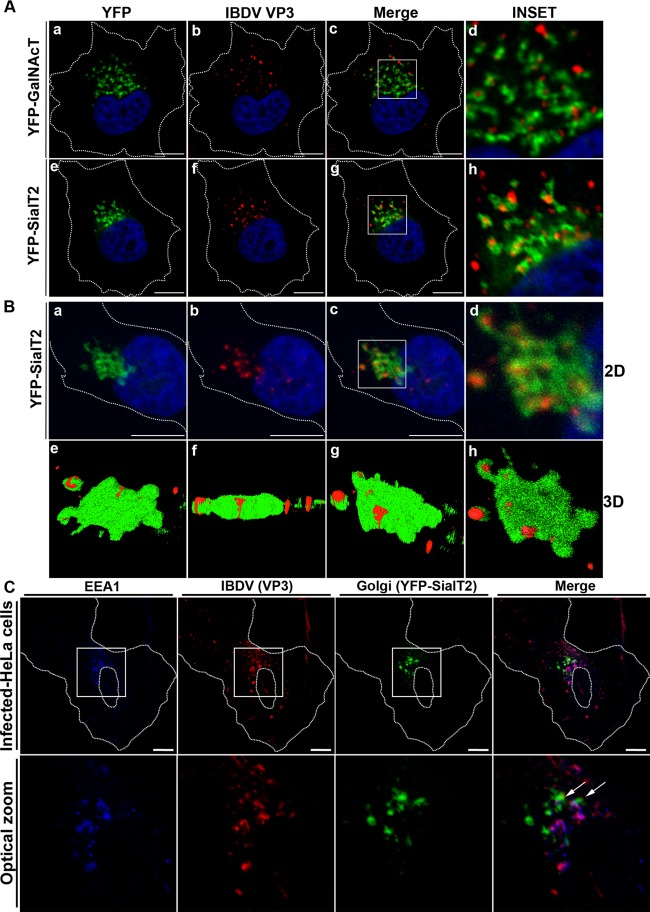
Fig 7.
IBDV VP3 associates with Golgi stacks. (A) pYFP-SialT2- and pYFP-GalNAcT-transfected HeLa cells were infected and processed for indirect immunofluorescence analysis with anti-VP3 (1:500) and the corresponding Cy3-conjugated secondary antibodies. The insets show a well-defined association of both structures, in which VP3 appears completely surrounded by SialT2- or GalNAcT-labeled structures. The nuclei were stained with Hoechst stain (blue). (B) z-stack fluorescence images were captured from a single cell, as described in Materials and Methods. (a to d) 2D images showing brightest-point projections of 10 images collected at 0.39-μm steps in the z axis. To better appreciate the green and red signal distributions, a close-up of the entire cell was done, showing only the perinuclear region where the signals are located. The nuclei were stained with Hoechst stain (blue). (e to h) Different rotation planes of the same data, displayed as 3D topographical reconstructions of VP3 and YFP-SialT2. (C) YFP-SialT2-transfected, IBDV-infected HeLa cells were processed for double immune staining with rat anti-VP3 and the corresponding Cy3-conjugated secondary antibody followed by anti-EEA1 and the corresponding Cascade Blue-conjugated secondary antibody. (Top) Image of a complete cell. (Bottom) Images of an optical zoom done with the cell in the top panel. White arrows indicate VP3-positive and EEA1-positive vesicles in close proximity to the Golgi stacks (green signal). Images are representative of three independent experiments. Scale bars represent 10 μm.

