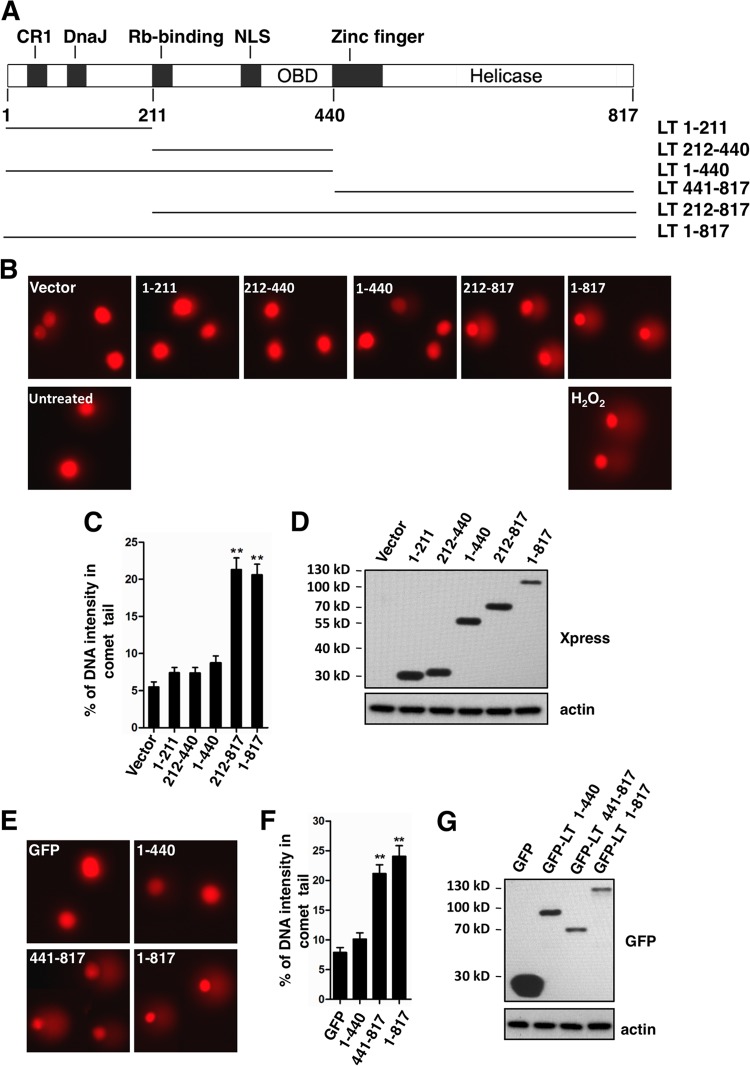
Fig 2.
MCV LT induces DNA damage in host genome. (A) Schematic diagram of the MCV LT protein and truncation mutants used in the present study. CR1, conserved region 1; DnaJ, Hsc70-binding conserved region; NLS, nuclear localization signal; OBD, origin-binding domain. (B) U2OS cells were transfected with pcDNA4C (Vector) or pcDNA4C encoding the indicated LT molecules. Cells were harvested at 36 h posttransfection and analyzed using a comet assay. For positive and negative controls, cells were treated with 100 μM H2O2 and PBS, respectively. Representative images of comets from three independent experiments are shown. (C) The percentage of DNA intensity in the comet tail was quantified from 100 randomly selected comet images for each transfection. Error bars represent mean ± the standard error of the mean (SEM) calculated from each transfection. Asterisks indicate significant difference (P < 0.01) compared to cells transfected with vector. (D) Expression of LT molecules in U2OS cells was detected by Western blotting with the indicated antibodies. (E) U2OS cells were transfected with pEGFPC1 (GFP) or pEGFPC1 encoding the indicated LT molecules. Cells were harvested at 36 h posttransfection and analyzed using the comet assay. Representative images of comets are shown. (F) The percentage of DNA intensity in the comet tail was quantified and presented as in panel C. (G) Expression of GFP-tagged LT molecules was detected by Western blotting with the indicated antibodies.

